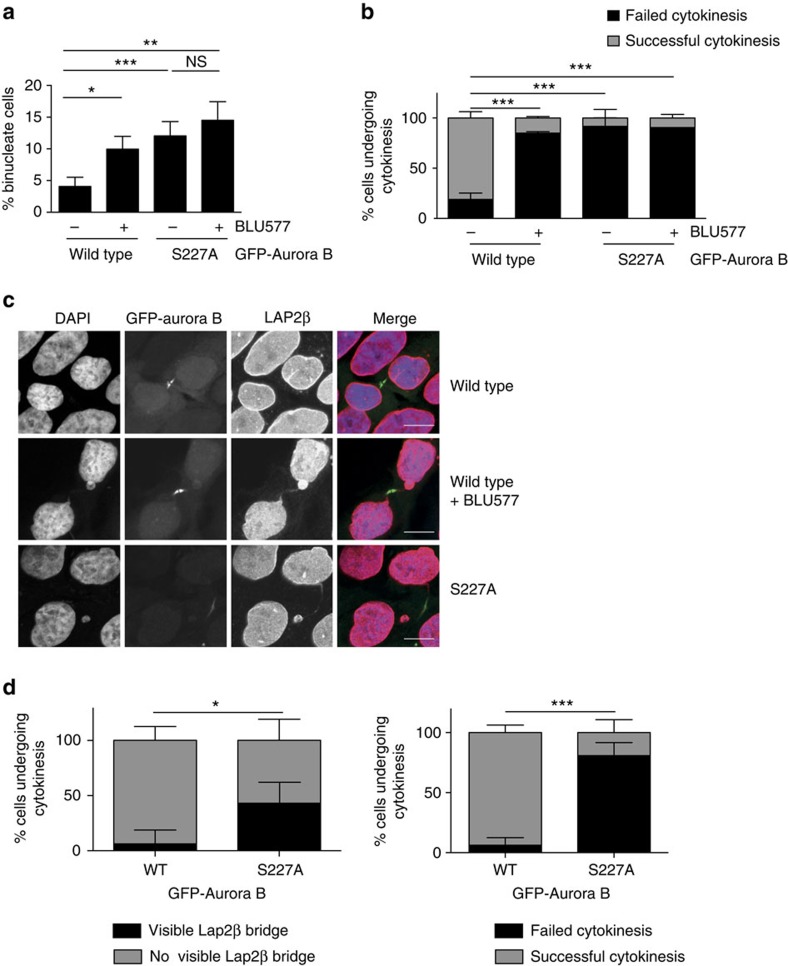
Figure 2. Aurora B S227 phosphorylation is required for successful completion of cytokinesis.
(a,b) Cells where PKCɛ is inhibited and/or Aurora B cannot be S227 phosphorylated do not undergo successful abscission. (a) The number of binucleate cells was assessed after 24 h induction of GFP-Aurora B WT (4.07%±1.45), GFP-Aurora B S227A (12.03%±2.27)±BLU577 (500 nM) (WT 9.97%±2.01 versus S227A 14.5%±2.94) expression in the DLD1 cell lines. Graph represents the mean (±s.e.m.) of three independent experiments of >500 scored cells per condition. Student's t-test, not significant (NS)=P>0.05, *=P≤0.05, **=P≤0.01, ***=P≤0.001. (b) Wide-field time-lapse microscopy of DLD1 GFP-Aurora B cell lines. Cells were scored for the outcome of cytokinesis where failed cytokinesis is a binucleate cell and successful cytokinesis resulted in two daughter cells. Cells were induced for GFP-Aurora B expression for 16 h before image acquisition. Graph represents the mean (±s.e.m.) of three independent experiments where a minimum of 100 cells were scored per condition. Two-way analysis of variance (ANOVA), ***=P≤0.001. (c,d) There is an increase in cells with DNA trapped in the cytokinesis furrow if PKCɛ is inhibited and Aurora B cannot be phosphorylated on S227. (c) Confocal images of DLD1 GFP-Aurora B (green) cell lines stained for Lap2β (red) to identify DNA (DAPI—blue) bridging during cytokinesis. Scale bar, 10 μm. (d) DLD1 GFP-Aurora B cell lines, which stably express RFP-Lap2β were assessed for the presence of a Lap2β-positive bridge as they underwent cytokinesis (WT 6.25%±12.5 versus S227A 43.125%±19.2; left panel) and the outcome of cytokinesis (binucleate cells: WT 6.25%±12.5 versus S227A 80.9%±21.5; right panel). Graph represents the mean (±s.e.m.) of three independent experiments where a minimum of 100 cells scored per condition. Two-way ANOVA, *=P≤0.05, ***=P≤0.001.

