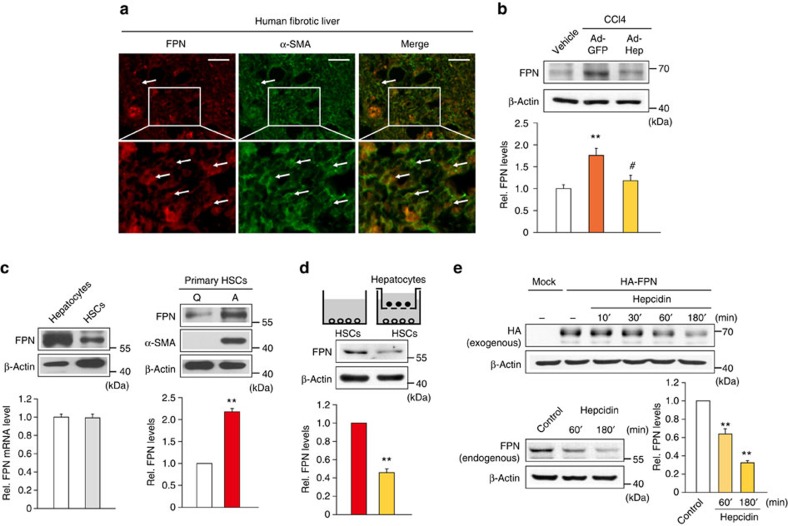
Figure 7. Hepcidin regulation of FPN in HSCs.
(a) Double immunofluorescence staining of FPN and α-SMA in a fibrotic liver section from patients as described in Fig. 1a. The proteins were stained with Cy3- and Alexa488-conjugated secondary antibodies, respectively. Arrows indicate co-localization of FPN and α-SMA in morphologically activated HSCs (scale bar, 50 μm). (b) FPN expression in the liver of mice treated as described in Fig. 5a. Data represent the mean±s.e.m. of at least three animals. Statistical significance of the differences between each treatment group and vehicle (**P<0.01), or CCl4+Ad-GFP (#P<0.05) was determined by analysis of variance (ANOVA; LSD method). (c) FPN expression in rat primary hepatocytes and rat primary HSCs (left), or in quiescent (freshly isolated, day 0) and activated (day 6 after culture) HSCs (right). (d) FPN expression in rat primary HSCs cultured alone or co-cultured with hepatocytes for 5 days. For c and d, data represent the mean±s.e.m. of three separate experiments. Statistical significance of the differences between quiescent (Q) and activated (A) HSCs in c (**P<0.01), and between HSCs alone and co-culture with hepatocytes in d (**P<0.01) was determined by unpaired two-sample Student's t-test. (e) Immunoblottings for HA-tagged or endogenous FPN. FPN was measured on the lysates of LX-2 cells transfected with Mock or HA-FPN, and treated with 100 nM hepcidin (upper), or of those treated with hepcidin for the indicated times (lower). Data represent the mean±s.e.m. of three separate experiments. Statistical significance of the differences between each treatment and control group (**P<0.01) was determined by ANOVA (Bonferroni's method).

