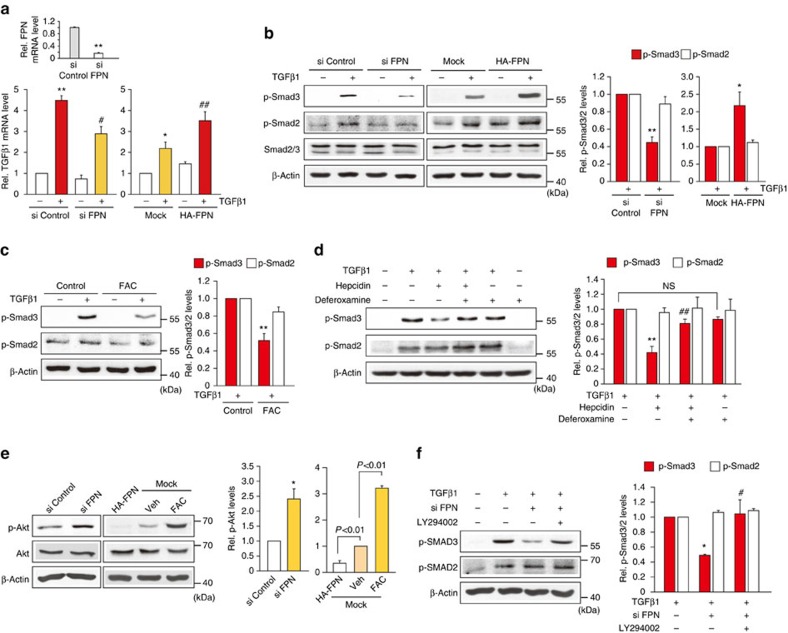
Figure 8. The effects of FPN modulations on TGFβ1 signalling pathway.
(a) qRT–PCR assays for TGFβ1 after FPN modulations. LX-2 cells were transfected with control siRNA or FPN siRNA for 48 h (left), or with Mock or HA-FPN for 24 h (right), followed by TGFβ1 treatment for 12 h. Inset shows FPN knockdown. Data represent the mean±s.e.m. of at least three separate experiments. Statistical significance of the differences between each treatment and control group (*P<0.05, **P<0.01) or TGFβ1 (#P<0.05, ##P<0.01) was determined by analysis of variance (ANOVA; Bonferroni's or LSD method). (b) Immunoblottings for p-Smad2 and p-Smad3 in LX-2 cells transfected as in a (TGFβ1 treatment for 20 min). (c,d) Immunoblottings for p-Smad2 and p-Smad3. For c, LX-2 cells were exposed to ferric ammonium citrate (FAC, 10 μM) for 30 min and continuously treated with 5 ng ml−1 TGFβ1 for 20 min. For d, the cells were exposed to hepcidin for 3 h after deferoxamine treatment (100 μM for 3 h), and were treated with TGFβ1 as above. (e) Immunoblottings for p-Akt in LX-2 cells transfected as in a (left) or in the cells transfected with HA-FPN or Mock for 24 h. Mock-transfected cells were treated with vehicle or FAC for 30 min (right). Data represent the mean±s.e.m. of three separate experiments. Statistical significance of the differences between each treatment and control group (*P<0.05) was determined by unpaired two-sample Student's t-test. (f) Immunoblottings for p-Smad2/3. The cells were transfected with control siRNA or FPN siRNA and continuously exposed to LY294002 followed by TGFβ1 treatment for 20 min. For b and c, data represent the mean±s.e.m. of three separate experiments. Statistical significance of the differences between each treatment and TGFβ1 group (*P<0.05, **P<0.01) was determined by unpaired two-sample Student's t-test. For d and f, data represent the mean±s.e.m. of three separate experiments. Statistical significance of the differences between each treatment and TGFβ1 group (*P<0.05, **P<0.01) or TGFβ1+hepcidin (#P<0.05, ##P<0.01) was determined by ANOVA (Bonferroni's method).

