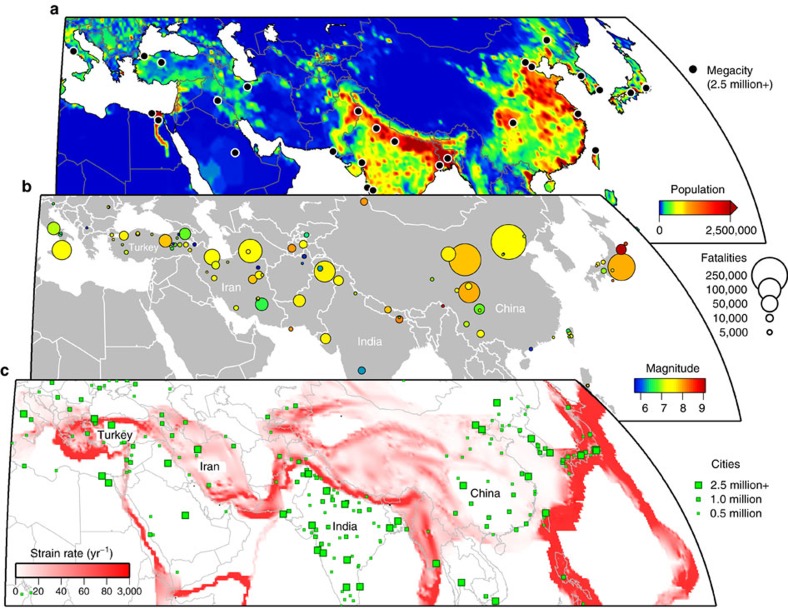
Figure 1. Distribution of current population relative to past fatal earthquakes and crustal strain across Eurasia.
(a) Population count on a half-degree by half-degree grid for 2005. Megacities with populations over 2.5 million are marked by black circles. Data are the UN-adjusted population count from the Center for International Earth Science Information Network (CIESIN), Columbia University, United Nations Food and Agriculture Programme (FAO) and Centro Internacional de Agricultura Tropical (CIAT) (http://sedac.ciesin.columbia.edu/gpw). (b) Locations of past earthquakes in the period 1900–2015 resulting in more than 1,000 fatalities are denoted by circles coloured by magnitude and scaled in size by the number of fatalities (source: USGS, http://earthquake.usgs.gov/earthquakes/world/world_deaths.php). On the continents, faulting and earthquakes are more distributed than for the oceans. (c) Global Strain Rate Model (v2.1) showing the second invariant of the strain rate tensor22. This model is based on measurements from over 22,000 GNSS sites around the world. However, distributed over such a wide area, the resulting strain rate map is of relatively low spatial resolution for most of the globe. Large cities are overlayed (green) and scaled by population size.

