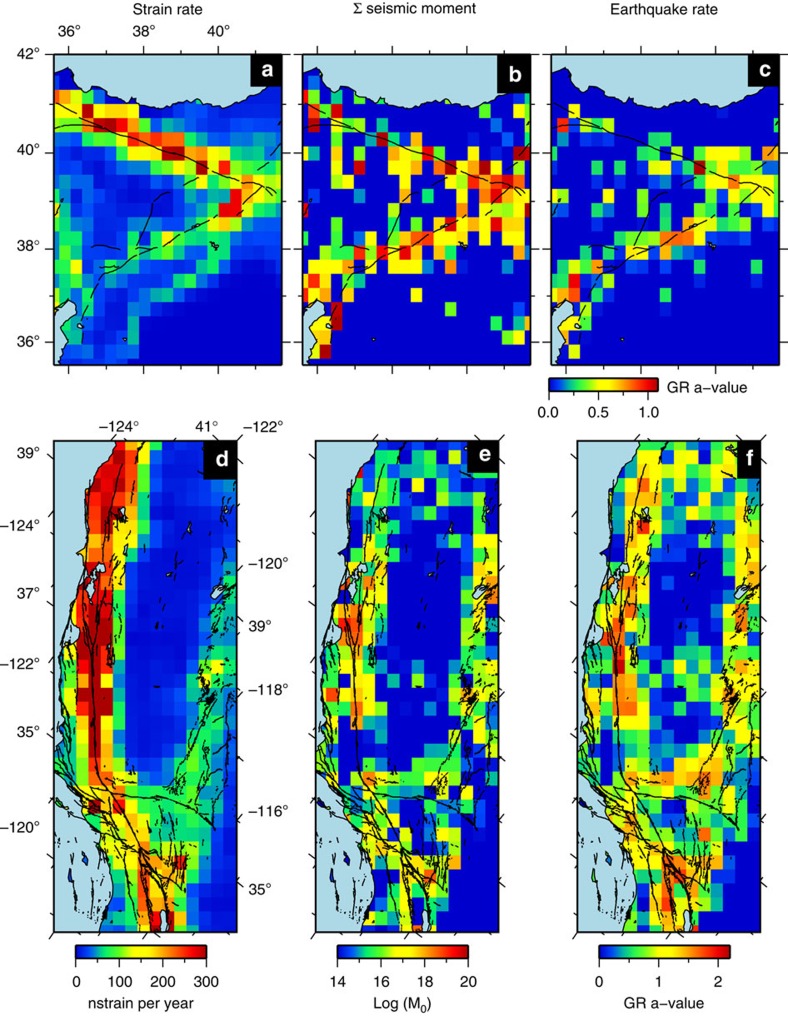
Figure 5. Comparison of strain rate against seismic strain and earthquake rate.
(a) Second invariant of the horizontal strain-rate tensor from the Global Strain Rate Model v2.1 (ref. 22) for Eastern Turkey, showing localized strain on the North and East Anatolian Faults (NAF and EAF respectively). Active fault traces are denoted by black lines122. (b) The log of the summed seismic moment since 1000 AD, derived from the declustered SHARE historical and instrumental seismic catalogue123 and calculated at 0.25° resolution. (c) The Gutenberg-Richter a-value calculated at the same resolution from the same data. d–f show the same for California and the San Andreas Fault Zone, with seismic parameters derived from declustered UCERF3 seismic catalogue124. Fault traces show structures assumed active since the late Quaternary from the USGS (http://earthquake.usgs.gov/hazards/qfaults/). For both Eastern Turkey and California, there is a clear relationship between geodetic strain-rate and both seismic moment and earthquake rate.

