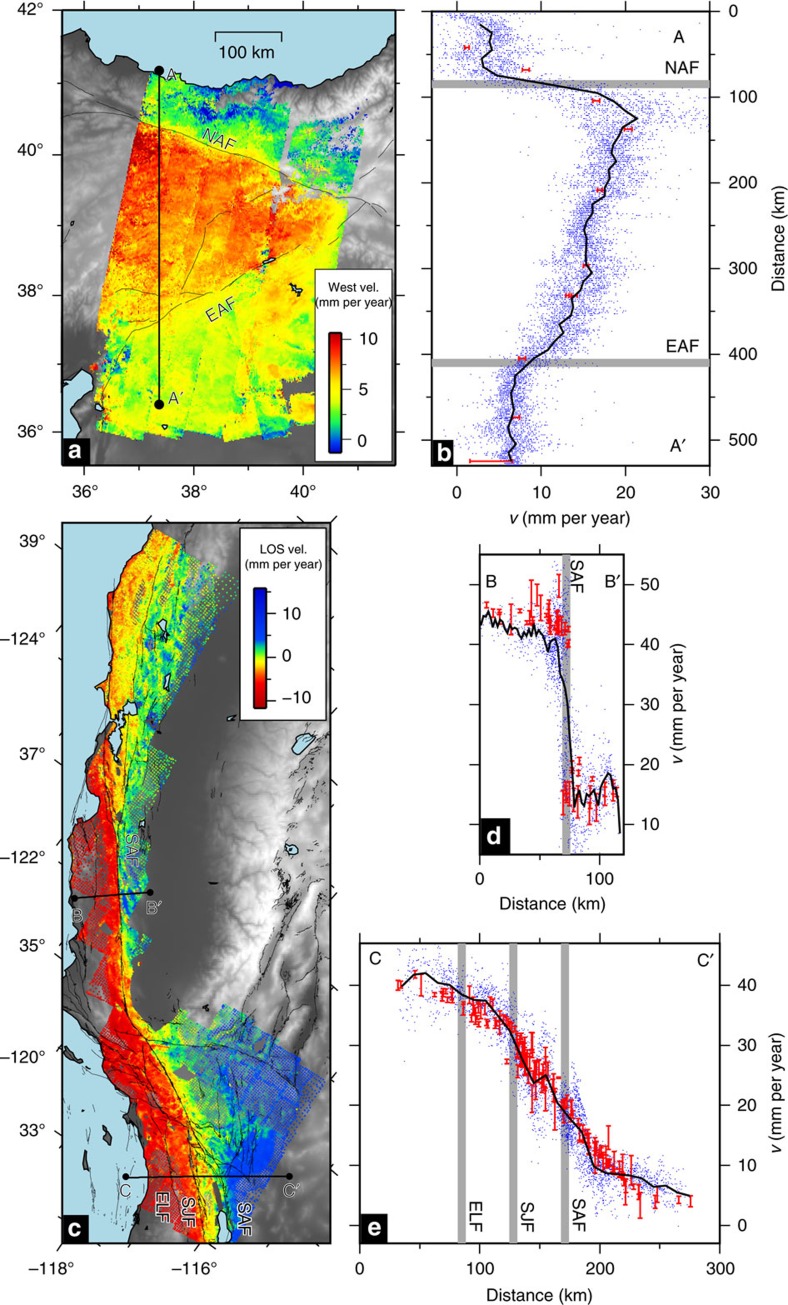
Figure 6. Examples of large-area interseismic measurements with InSAR.
(a) InSAR interseismic crustal velocities in Eastern Turkey79. A mosaic of five overlapping descending and ascending tracks from the ENVISAT satellite is shown, augmented with unpublished data from one additional descending track. Velocities are presented as westward motion only, under the assumption of zero vertical differential motion across the region and small sensitivity of the instrument to north–south motion. Line C–C′ shows the location of the profile in b through the North Anatolian Fault (NAF) and East Anatolian Fault (EAF). Active fault traces are denoted by black lines122. (b) Profile of westwards velocity where blue points are InSAR measurements and red bars are GNSS velocities with one sigma uncertainties, within 30 km of the profile lines. The black line shows the mean InSAR velocity and the grey vertical bars show the locations of major strike-slip faults. Localized deformation across the NAF and EAF, with little deformation away from these fault zones. The gradient of velocity in Anatolia, the region between the NAF and EAF, does not reflect strain but the bulk horizontal rotation of Anatolia. (c) InSAR interseismic crustal velocities along the San Andreas Fault Zone (SAF), California78, shown at the same spatial scale as panel a. Velocities are shown in the satellite's line of sight and are a mosaic of 13 overlapping ascending tracks from the ALOS-1 satellite. Lines A–A′ and B–B′ show the location of the profiles in d,e through the San Andreas Fault (SAF), San Jacinto Fault (SJF) and Elsinore Fault (ELF). Fault traces show structures assumed active since the Late Quaternary from the USGS (http://earthquake.usgs.gov/hazards/qfaults/). (d,e) Profiles of assumed fault-parallel motion where blue points are InSAR measurements and red bars are GNSS velocities with one sigma uncertainties, within 30 km of the profile lines. The black line shows the mean InSAR velocity and the grey vertical bars show the locations of major strike-slip faults. (d) Fault creep across the SAF, represented by a sharp step in velocity across the fault. (e) Distributed shear across three major and closely spaced faults in the San Andreas Fault Zone, the ELF, SJF and SAF.

