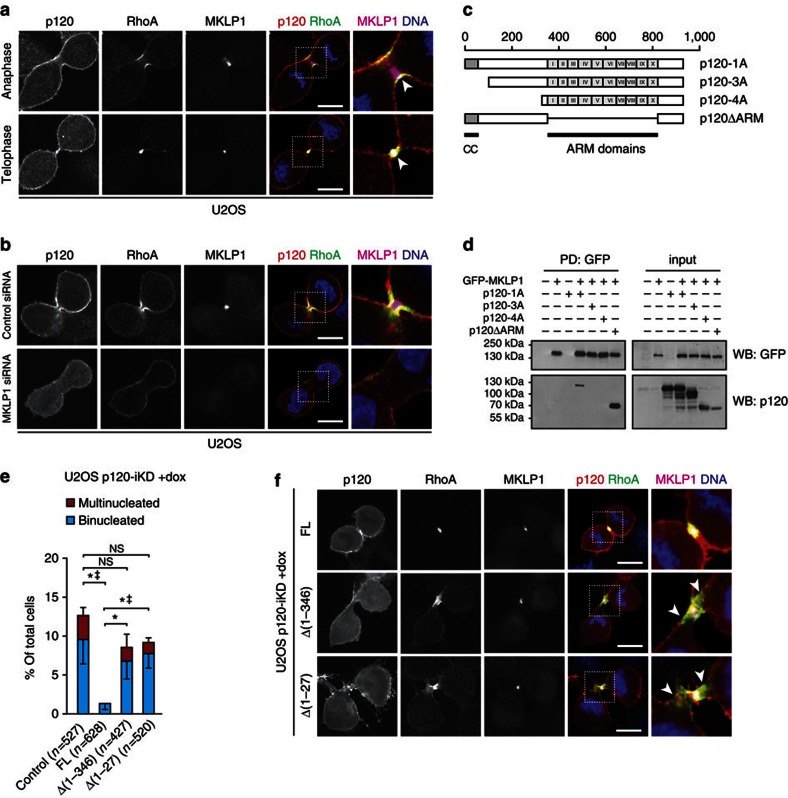
Figure 5. p120 interacts with MKLP1 to regulate focused RhoA activity during cytokinesis.
(a) IF for p120, RhoA and MKLP1 in anaphase and telophase U2OS. Note the co-localization of p120, RhoA and MKLP1 at the equatorial cortex (arrowheads). Right panels show representative magnifications of representative areas denoted by the dotted squares. Scale bar, 10 μm. (b) IF for p120, RhoA and MKLP1 in U2OS cells transfected with control and MKLP1-specific siRNAs. Right panels show magnifications of representative areas denoted by the dotted squares. Scale bar, 10 μm. (c) Overview of the different p120 constructs used. CC=coiled-coil domains, ARM=Armadillo. Scale bar denotes the amino acid position. (d) Western blot showing the co-immunoprecipitations for GFP-MKLP1 and p120 constructs described in c. (e) Quantification of bi- and multinucleation in dox-treated U2OS p120-iKD reconstituted with empty vector (control), FL p120-1A, p120-1AΔ[1–346], and p120-1AΔ[1–27]. Statistical significance was determined using the Student’s t-test. Shown are the data from three independent experiments. Results are expressed as mean±s.d. *P<0.05/‡P<0.05 (binucleation and multinucleation, respectively). (f) IF for p120, RhoA and MKLP1 in dox-treated U2OS p120-iKD cells reconstituted with FL p120-1A, p120-1AΔ[1–346] and p120-1AΔ[1–27]. Note the broadened RhoA zone in cells reconstituted with p120-1AΔ[1–346] and p120-1AΔ[1–27] (arrowheads). Scale bar, 10 μm.

