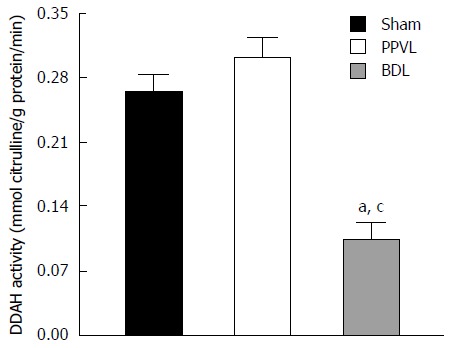
Figure 5.

Effects of portal hypertension and cirrhosis on renal dimethylarginine dimethylaminohydrolase activity. Bar graphs represent DDAH activity in kidney from Sham, PPVL, and BDL groups. Each data set represents the mean ± SEM derived from 6 independent experiments. aP < 0.05 vs Sham group and cP < 0.05 vs PPVL group. DDAH: Dimethylarginine dimethylaminohydrolase.
