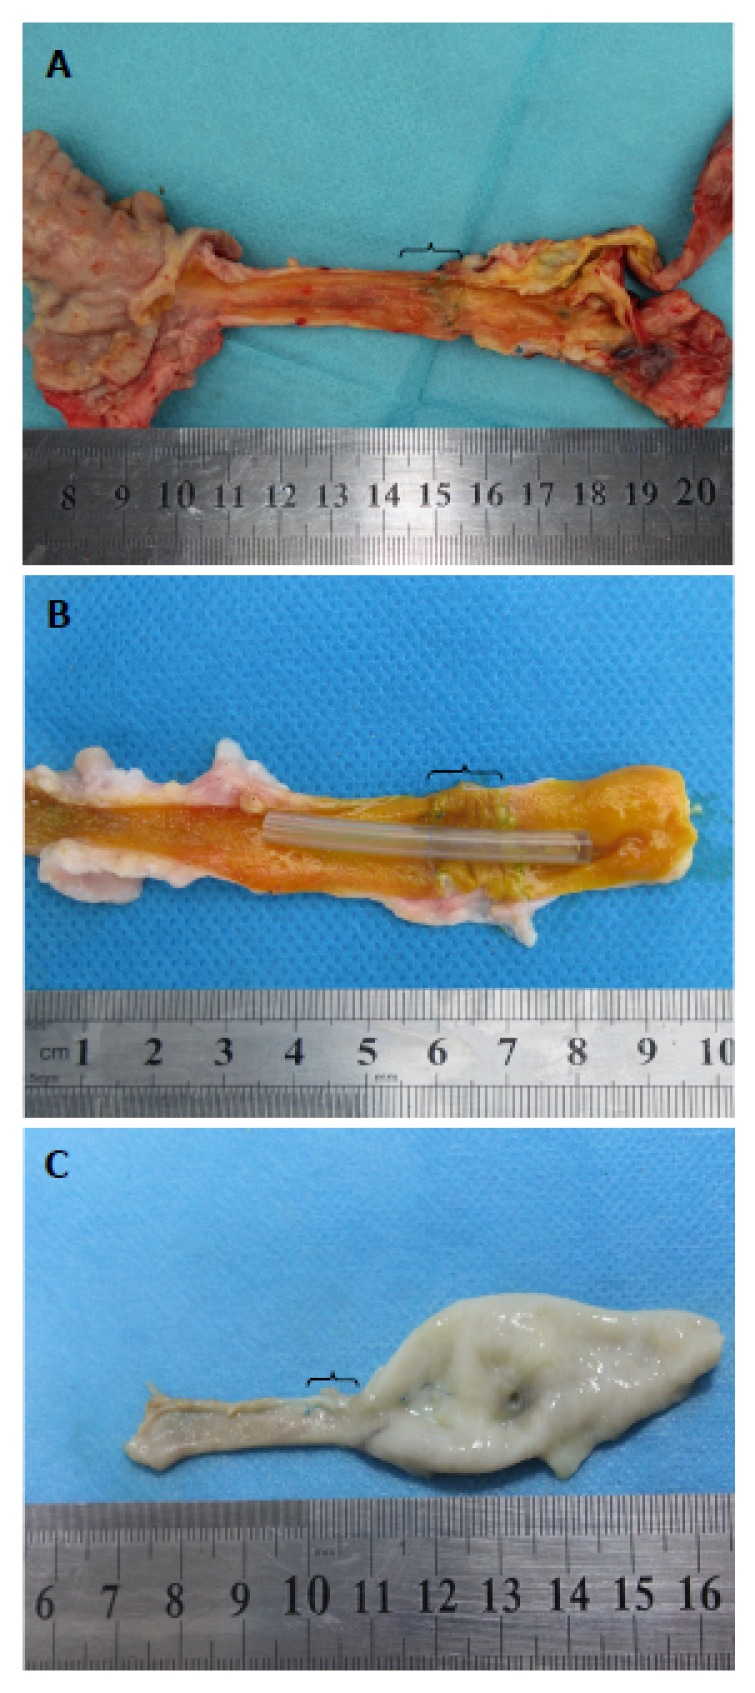
Figure 5.

Macroscopic results. A: Explanted bile duct of a 3-mo survivor in the T-tube group; B: Explanted bile duct of a 3-mo survivor in the stent group; C: Explanted bile duct of an animal who died at 1 mo in the stentless group. Brackets indicate the area of graft interposition.
