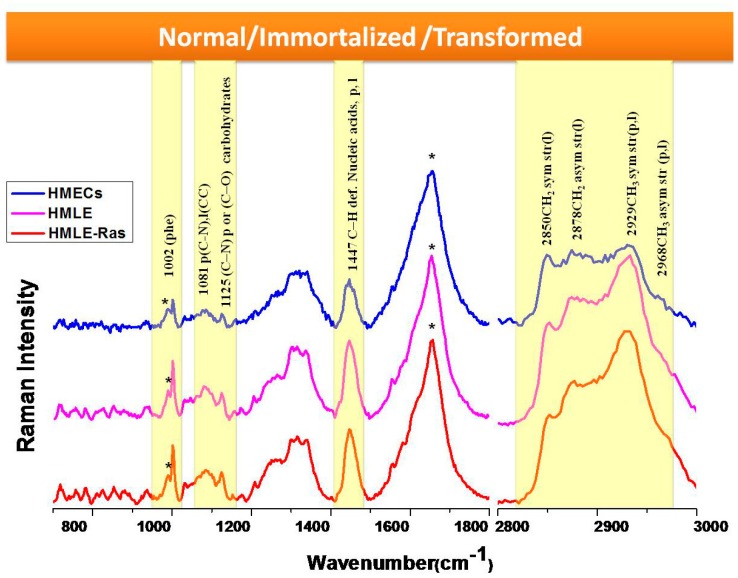
Figure 2.
Raman spectra (700–1800 cm−1 and 2800–3000 cm−1) from live HMECs, HMLE, and HMLE-Ras cells. Each spectrum is an average of 30 spectra. Raman spectra were acquired in 25 s and had the baseline subtracted manually. Spectra are normalized and vertically offset for clarity. * = background, ** = water background + Amide I, p = protein, l = lipid.

