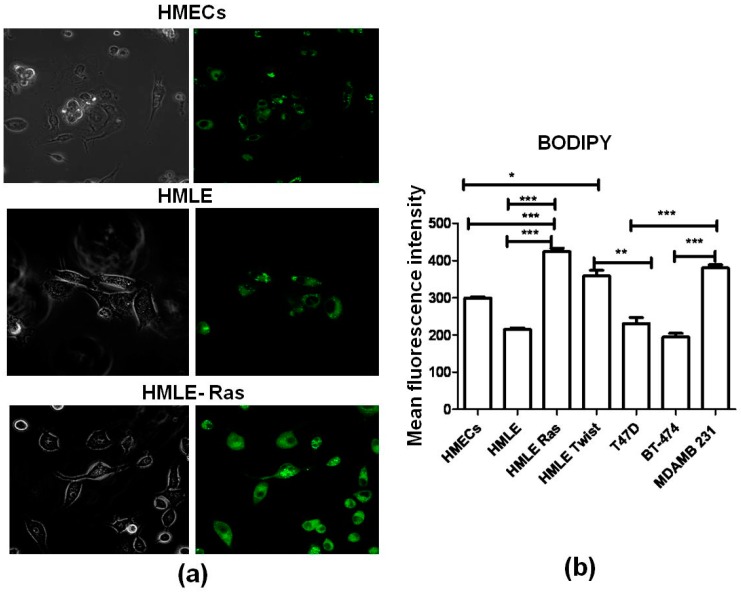
Figure 7.
(a) Analysis of the phospholipid content in different cell lines (HMECs, HMLE, HMLE-Ras) using BODIPY staining. The left-hand images were observed in bright field; theright-handimages ware observed in green-fluorescence mode; 60× magnification in confocal microscope Olympus FV-10I). (b) Average fluorescence intensities (BODIPY 493/503) across different cell lines. Error bars represent standard error of the mean (SEM); (n = 3), where n is the number of experiments and significant differences are indicated by *.

