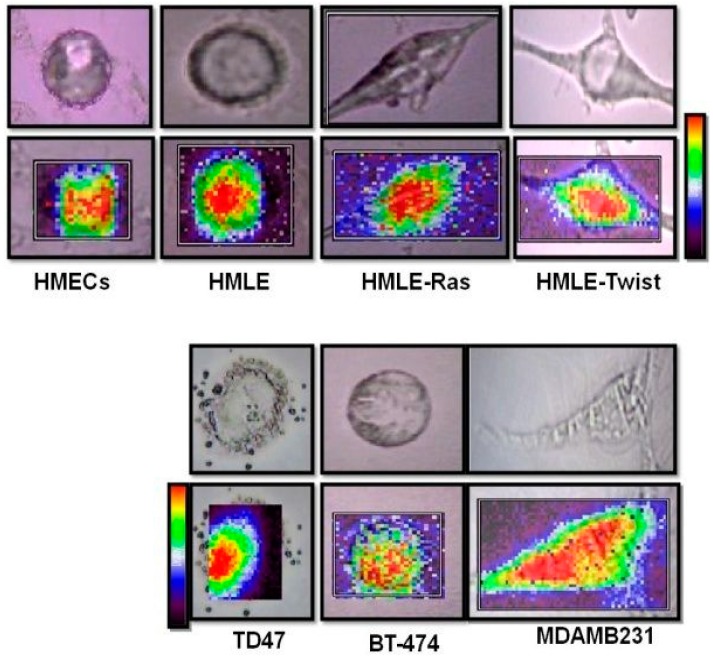
Figure 9.
Single cell bright field images (top) and Raman maps created using baseline subtracted peak areas for the range 2800–3050 cm−1 (lipid, bottom) of each of the seven cell lines, HMECs, HMLE, HMLE-Ras, HMLE-Twist, T47D, BT-474, and MDAMB231. High Raman intensities are displayed in red while low Raman intensities appear in violet.

