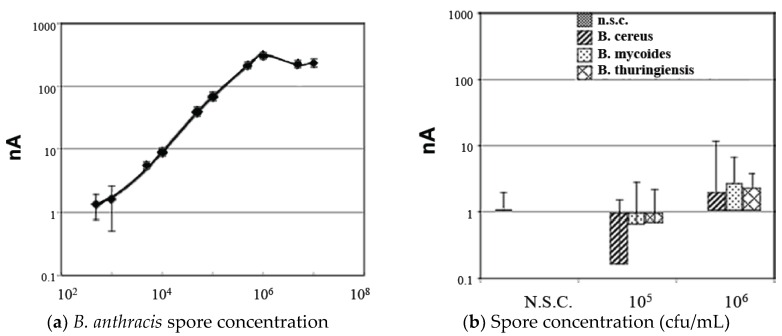
Figure 2.
(a) Standard curve for detection of pure B. anthracis spore suspensions (spores serially diluted in 0.1% Tween 20). Each data point represents at least 10 blindly tested sample replicates. Error bars = +/− standard deviation (SD). (b) Negative control samples including no spore controls (0.1% Tween 20 without spores) and spores of other Bacillus species tested in the assay at the indicated concentrations.

