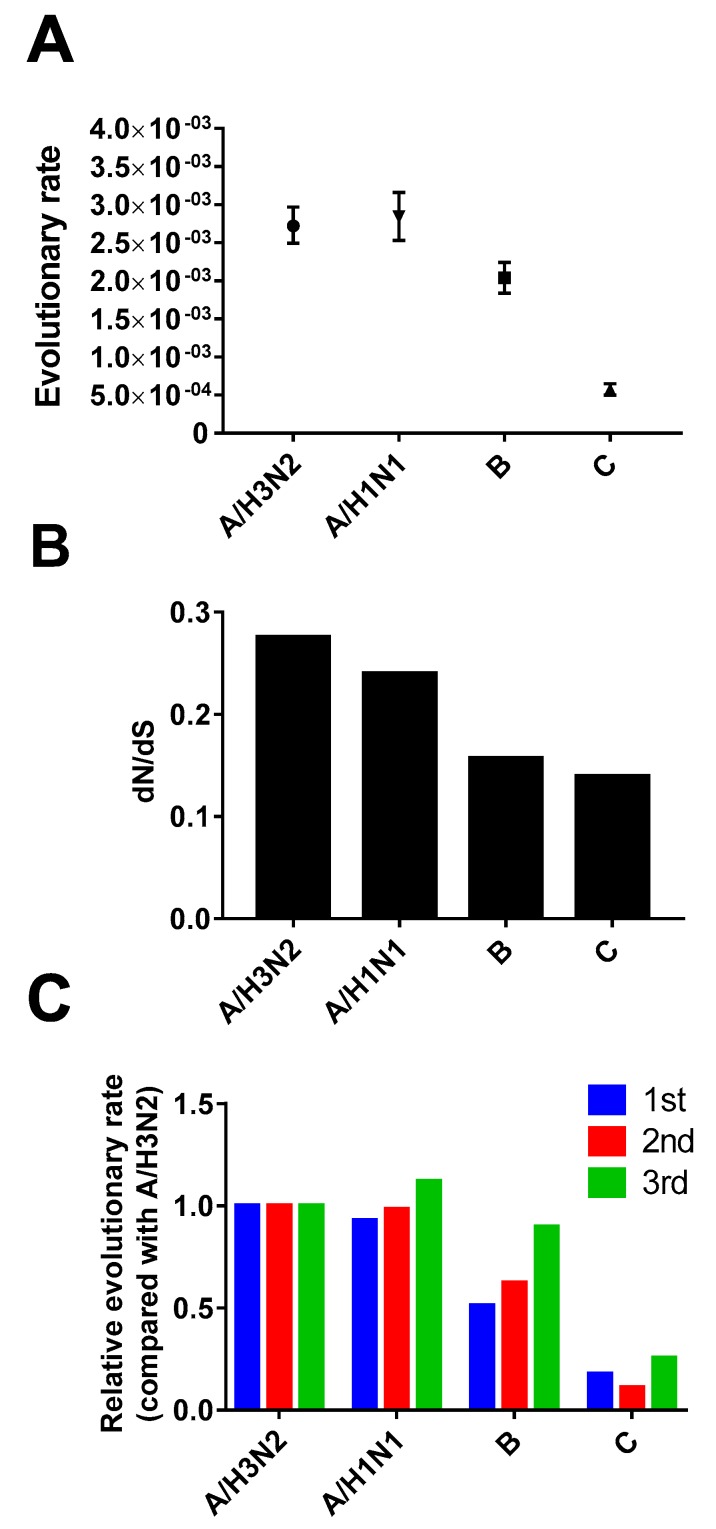
Figure 4.
Evolutionary rate and selection pressure of influenza A, B, and C viruses. (A) Evolutionary rate (nucleotide substitution per site per year); (B) selection pressure (relative rate of non-synonymous and synonymous mutation); and (C) relative evolutionary rate of each position in the codon compared with the influenza A/H3N2 virus. In all three panels, results were calculated using data of the HA gene for influenza A and B viruses and the HE gene for the influenza C virus. Error bars show 95% highest posterior density intervals.

