Figure 1.
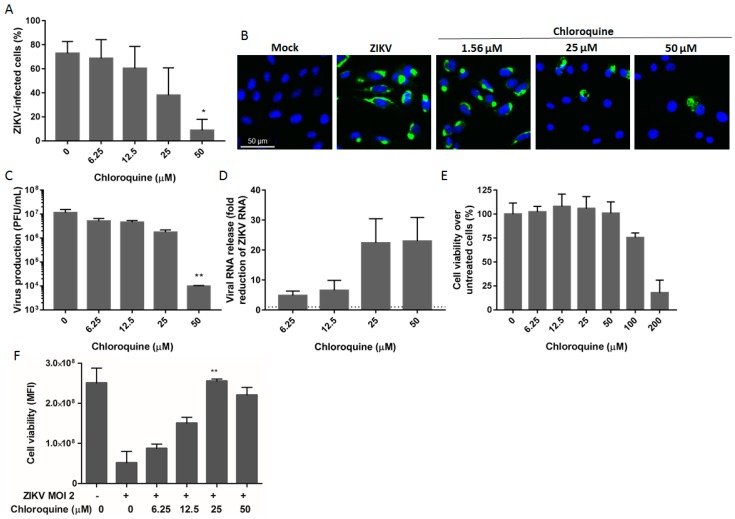
Inhibition of Zika virus (ZIKV) infection by chloroquine in Vero cells. (A) Vero cells were infected with ZIKV MR766 at a multiplicity of infection (MOI) of 2, treated with chloroquine for 5 days, and were then stained for the viral envelope protein and analyzed by flow cytometry; (B) Vero cells were infected, treated for 2 days, and ZIKV infection was evaluated by immunofluorescence staining with 4G2 antibody (green) and DAPI (blue); Infectious (C) or total (D) virus particles were quantified on the supernatant 48 h post-infection. Titers are expressed as plaque forming units (PFU) per milliliter. The dashed line represents no reduction in RNA levels; (E) Cell viability of uninfected cells treated with increasing concentrations of chloroquine was evaluated by fluorescence measurement at 560/590 nm after viability dye incubation; (F) Protection against ZIKV infection was evaluated through cell viability in ZIKV-infected Vero cells treated with chloroquine for 5 days. Data are represented as mean fluorescent intensity (MFI) ± standard deviation (SD) from two to four independent experiments. Statistical analysis was performed with the Kruskal–Wallis test and multiple comparisons with infected and untreated control corrected by Dunn’s test (* p < 0.05; ** p < 0,005).

