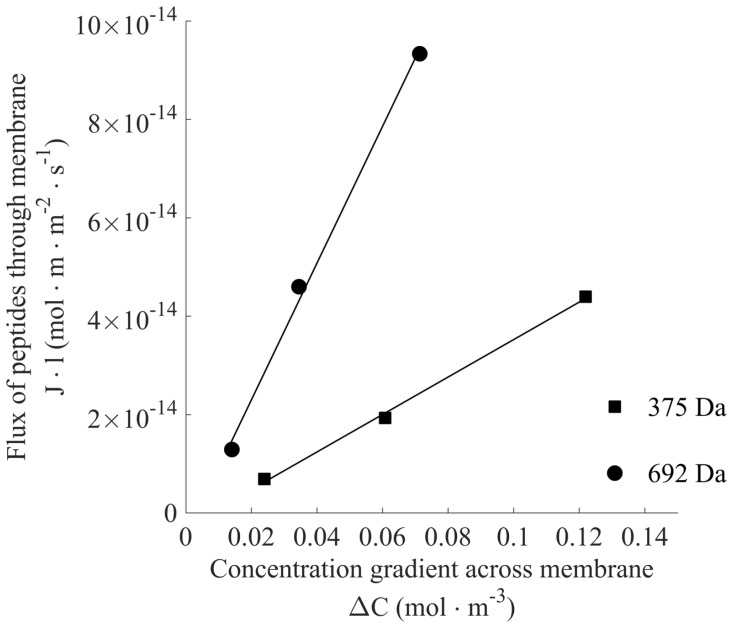
Figure 3.
Molar flux of peptides across the membrane. The graph shows the molar peptide flux over the membrane as a function of the concentration gradient across the membrane. Each concentration point is a mean value of triplicate experiments at that concentration. The slope of the graph gives the membrane permeability for each peptide. The linear regression coefficients are 0.99792 (375 Da) and 0.99817 (692 Da).

