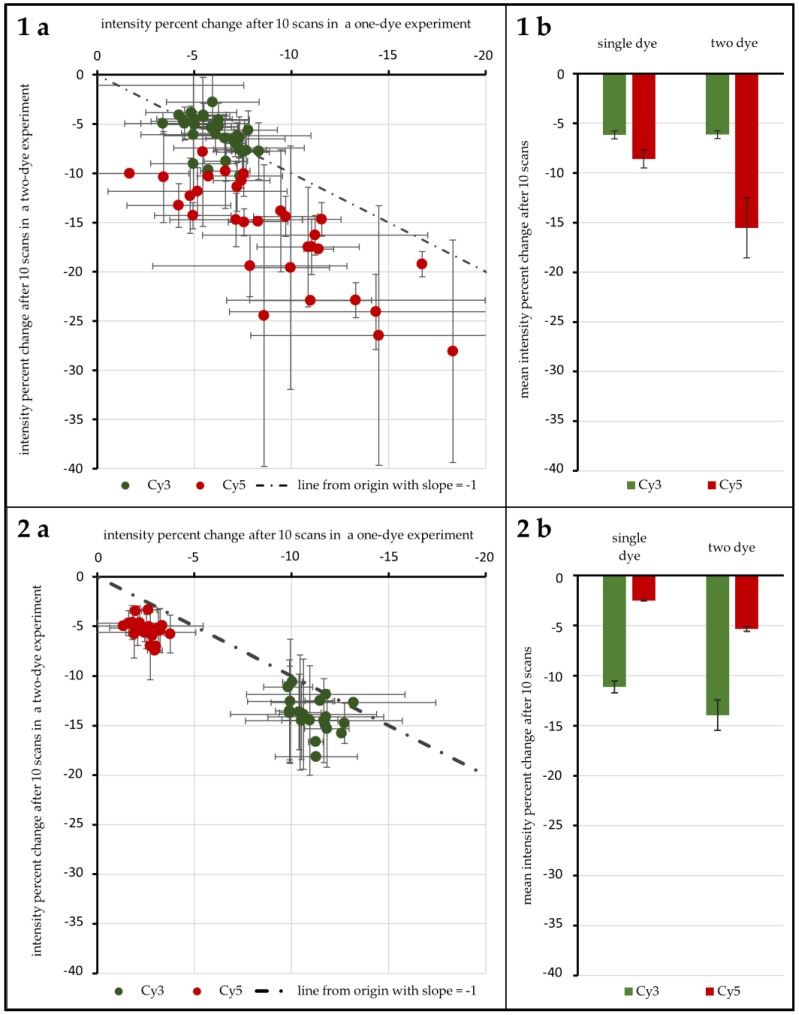
Figure 4.
Results of the 96 gene experiment. The intensity percent change after 10 scans is compared for Cy3 and Cy5 depending on the presence/absence of their FRET partner. The percent change for one-dye setups is plotted against the same value derived from two dye experiments for unprotected spots (1a) and spots protected by 1 mM ROXS in 1× PBS (phosphate buffered saline) (2a). The dotted lines pass through the origin with a slope of −1. For each distribution the resulting means are given in (1b,2b). Error indicators are the respective standard errors (confidence: 95.4%) with Gaussian error propagation.

