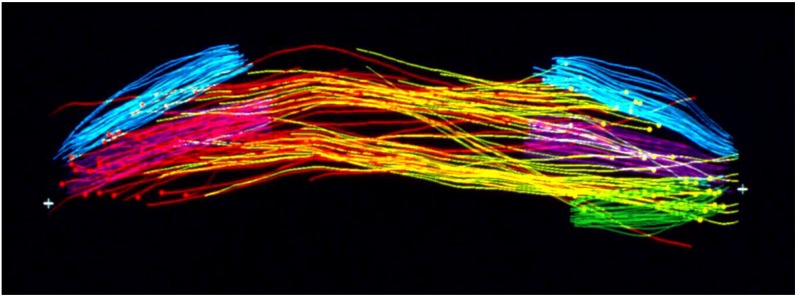
Figure 12.
The paths of many spindle MTs, traced through serial sections of a mammalian cell (strain PtK2) in anaphase. White crosses mark the positions of the poindle poles. The shorter bundles of colored lines represent the kinetochore MTs that cluster to form the kinetochore fibers visible in the light microscope. (Colors are used simply to make these clusters stand out.) The red and yellow lines represent non-kinetochore MTs, which are associated with one pole or the other and interdigitate at the spindle’s midplane to make the “interpolar” spindle. These MTs slide and elongate during anaphase B. Image kindness of D. Mastronarde, Univ. Colorado.

