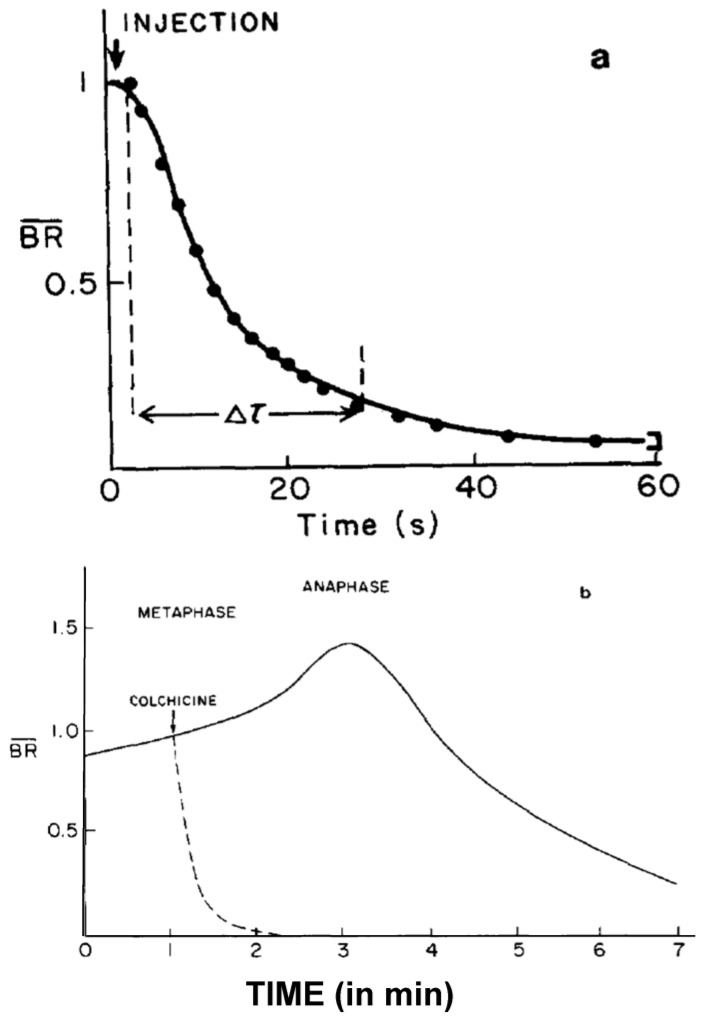
Figure 20.
Changes in spindle birefringence (BR) in the half spindle as measured by a video spot meter. (a) Tracing of the chart record of the video voltage following injection of colchicine (0.2 mM) into a first division metaphase cell. The characteristic time, Δτ, of nonkinetochore MT depolymerization is measured by the time between the onset of BR decay and the time where the video voltage decreases to 10% of the initial value. The line is a first-order decay curve for k = 0.092. Spindle BR is normalized by the initial value at the time of injection; (b) Comparison of the rate of disappearance of normalized spindle BR after 1.5 mM intracellular colchicine injection with the normal rate of half-spindle disassembly at late anaphase. From Salmon et al., 1984 [149]. This image is displayed under the terms of a Creative Commons License (Attribution-Noncommercial-Share Alike 3.0 Unported license, as described at http://creativecommons.org/licenses/by-nc-sa/3.0/.

