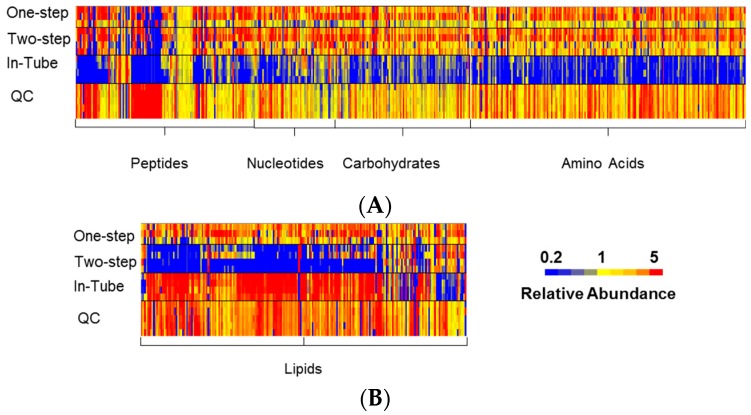
Figure 3.
Heat map of relative abundance of metabolites detected for each sample from the three extraction methods: Putatively identified metabolites clustered according to pathway/class (from Ideom database) and relative abundance shown as LC-MS peak height normalized to the mean for each metabolite. Heat map shows low relative abundance (blue) of polar metabolites (A) and high relative abundance (red) of lipids (B) for the “in-tube” method. Low recovery (blue) of lipid metabolites (B) is evident for the “two-step in-plate” method. Minimal variance observed within the quality control (QC) samples (all five replicates shown) confirms the excellent technical precision of the LC-MS method.

