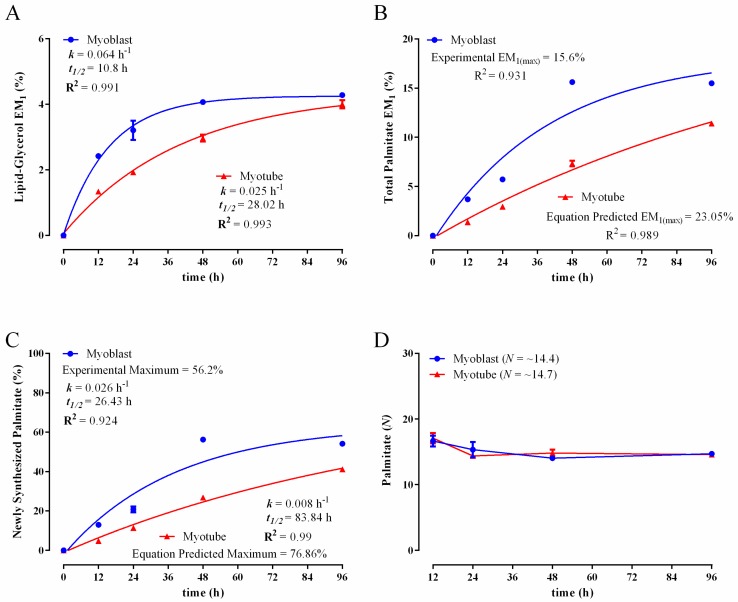
Figure 4.
Comparison of 2H-incorporation into lipid-derived glycerol and total palmitate in C2C12 myoblasts and myotubes following incubation in the presence of 4% 2H2O. Excess molar enrichment in the M1 isotopomer (EM1) over time in lipid-derived glycerol (A) and total intracellular palmitate (B) in myoblasts and myotubes. Percentage of newly-synthesized palmitate in myoblasts and myotubes (C). The experimental maximum (plateau) value represents the percentage of the total intracellular palmitate pool that was de novo derived. For myotubes, given that plateau values were not experimentally achieved, this value was equation predicted. The maximum number of exchangeable carbon bound hydrogens (N) in palmitate as determined using mass isotopomer distribution analysis (MIDA) (D). Inset: fractional synthesis rate constant (k), half-life (t1/2) and goodness-of-fit (R2) from non-linear curve fitting. N values seen in the brackets of the legend (D) are an average of those obtained at the 48- and 96-h time points; these exhibited the greatest amount of labelling and, therefore, permit the most accurate calculation of N using MIDA. Two replicates were performed for each time point. Error bars represent the standard error of the mean (SEM).

