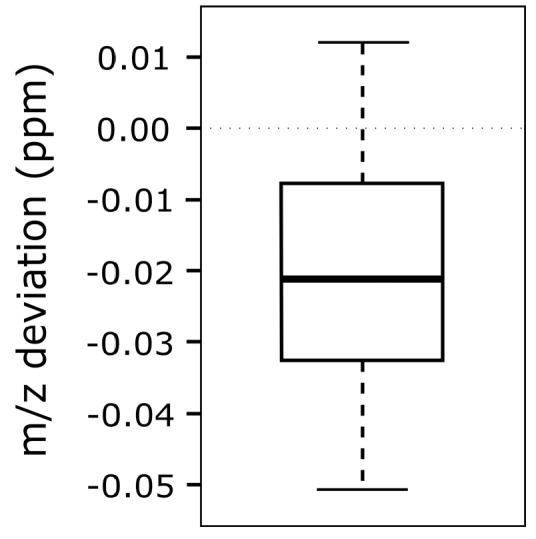
Figure 8.

Box-plot showing the differences between imposed and detected mass-to-charge ratio (m/z) offset. A chromatogram was matched to 21 modified feature lists obtained by processing the same datafile with MetExtract and artificially imposing m/z offset values of −10 to +10 ppm, with 1 ppm increments per list.
