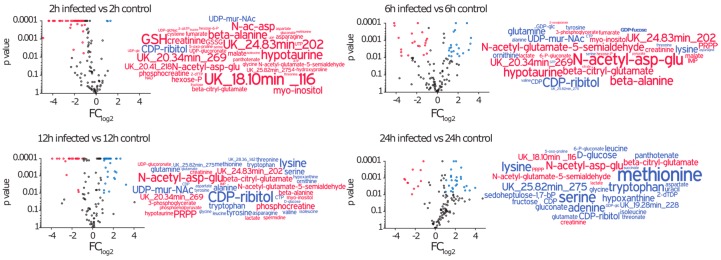
Figure 3.
Time dependent metabolic profiles of A549 cells after exposure to S. aureus. Volcano plots display the log2 transformed fold change of intracellular metabolite amounts (normalized on 107 cells) of infected versus control cells and the corresponding p-value (n = 3–9 out of at least three independent experiments). Metabolites with a p-value < 0.01 are coloured blue when FClog2 > 1 and red when FClog2 < −1. Significantly changed metabolites are displayed in word clouds in the corresponding colours and relative font size.

