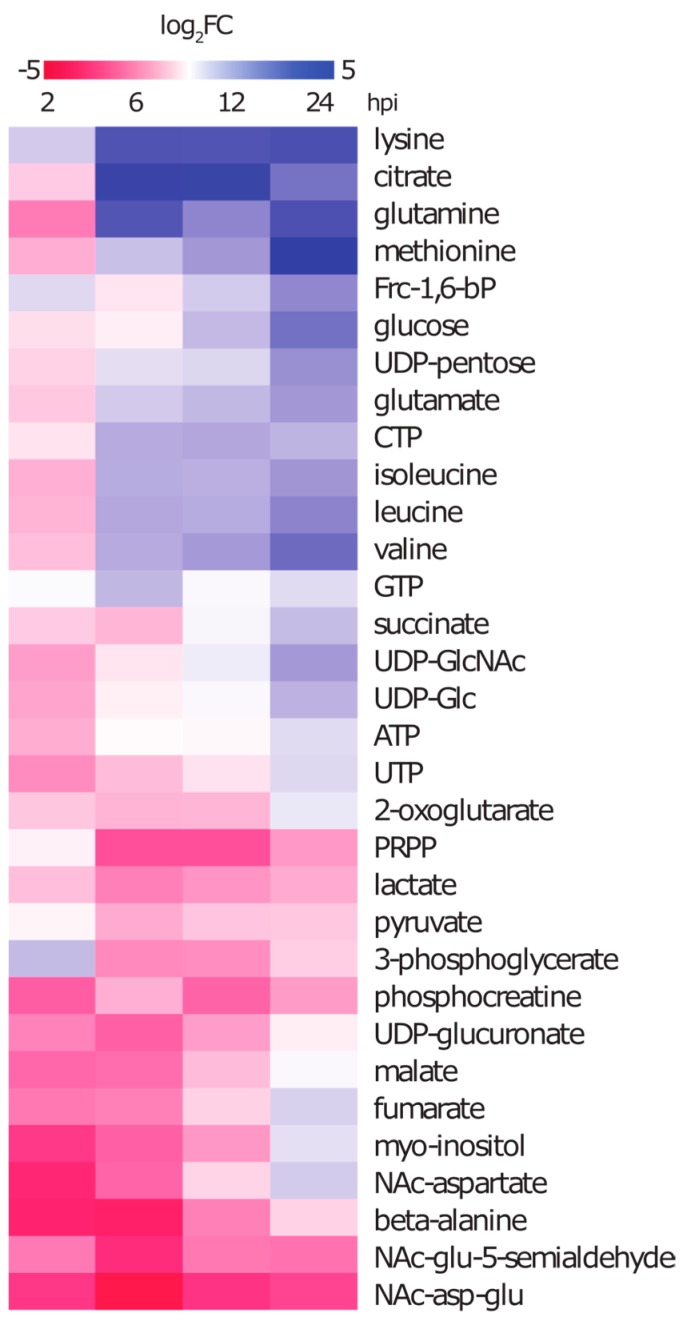
Figure 4.
Fold change development of selected metabolites. Time dependent FClog2 (infected vs. control) of selected intracellular amino acids, metabolites of primary carbon metabolism, nucleotides and other identified metabolites are presented in a colour coded chart. Red indicates a lower amount and blue indicates a higher amount of the metabolite in infected cells compared to control cells.

