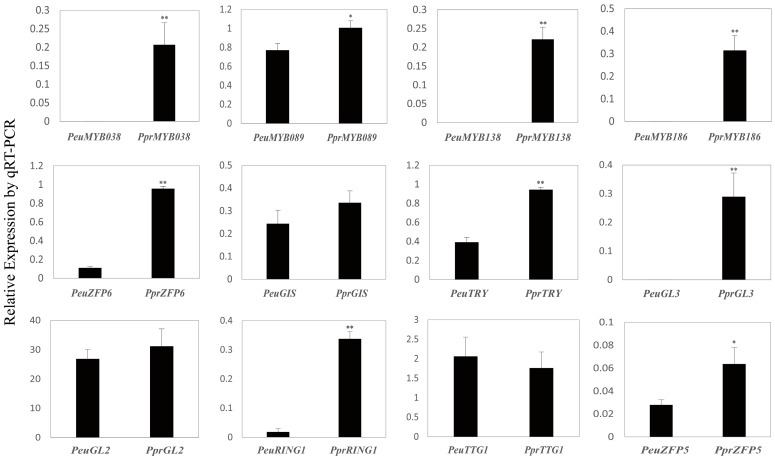
Figure 7.
Verification of transcriptome data by quantitative real-time PCR (qRT-PCR). Eight gene pairs related to trichome formation were selected for qRT-PCR verification. All showed similar patterns of expression to those identified from transcriptome data. The vertical bars indicate standard deviations. Asterisks indicate statistically significant differences using Student’s t-test (**: p < 0.001; *: p < 0.05).

