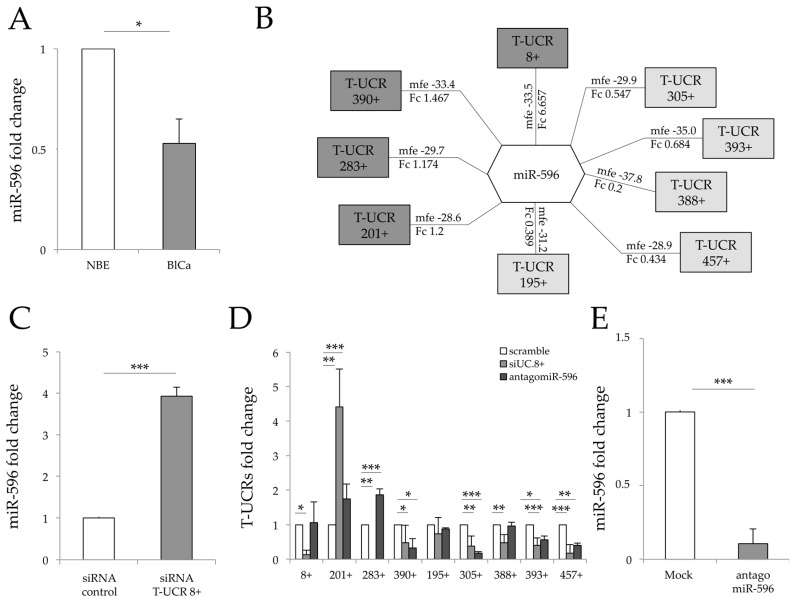
Figure 1.
Transcribed ultraconserved regions (T-UCRs)::miR-596 interaction network and long non-coding RNA (lncRNA) expression levels following T-UCR 8+ and miR-596 downregulation. (A) miR-596 fold change comparison between bladder cancer (BlCa) and normal bladder epithelium (NBE) samples. We compared miR-596 expression in 24 BlCa patient samples and 17 NBE samples (clinical characteristics shown in Table S4); (B) Schematic representation of T-UCRs::miRNA-596 possible network. For each T-UCR, the minimum free energy (mfe) involved in miRNA-596 binding and the fold change (Fc) in BlCa samples compared to NBE are reported. Upregulated and downregulated T-UCRs in J82 bladder cancer cell lines are shown in dark grey and light grey respectively; (C) miR-596 expression change in T-UCR 8+-silenced cells vs scramble oligo-transfected cells; (D) Real-time quantification of the selected T-UCRs in T-UCR 8+ J82-silenced cells and in antagomiR-596 and scramble oligo-transfected cells; (E) Real-time dosage of miR-596 in antagomiR-596-transfected cells. Data are reported as fold change considering scrambles equal to 1 and as mean ± standard deviation (SD) of triplicate values. p values were obtained using the Student t-test for three independent samples. * p < 0.05, ** p < 0.01, *** p < 0.001 vs controls.

