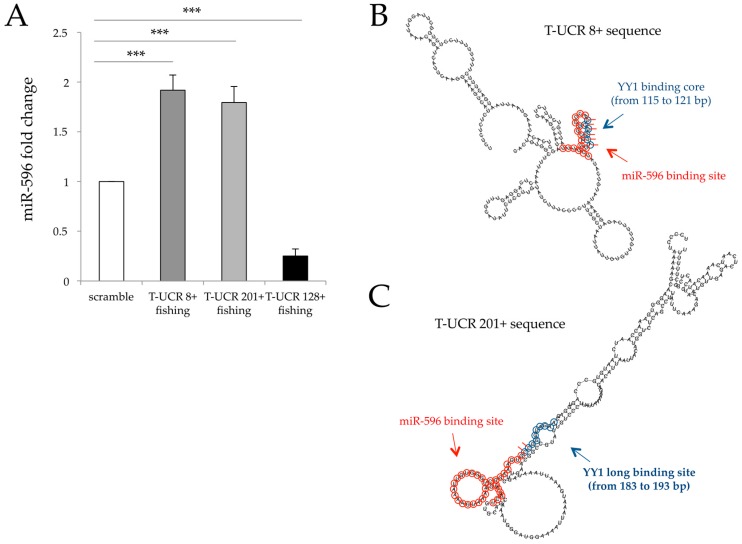
Figure 2.
miR-596::T-UCR 8+/201+ binding, T-UCR 8+/201+ secondary structure and miR-596 and YY1 binding site. (A) Real-time PCRs and fold change of miR-596 pull down with peptide nucleic acid (PNA)/T-UCR 8+, (PNA)/T-UCR 201+ and (PNA)/T-UCR 128+ in J82 cancer cell line; (B) Predicted RNA secondary structure of T-UCR 8+ with miR-596 (circles in red) and YY1 (circles in blue) binding site. The short red lines indicate regions in which both miR-596 and YY1 bind T-UCR 8+ sequence; (C) Predicted RNA secondary structure of T-UCR 201+ with miR-596 (circles in red) and YY1 (circles in blue) binding site. The short red lines indicate regions in which both miR-596 and YY1 bind T-UCR 201+ sequence. Scramble value is considered equal to 1. Data are expressed as the mean ± SD of triplicate values. p values were obtained using the Student t-test for three independent samples. *** p < 0.001 vs. control.

