Figure 1.
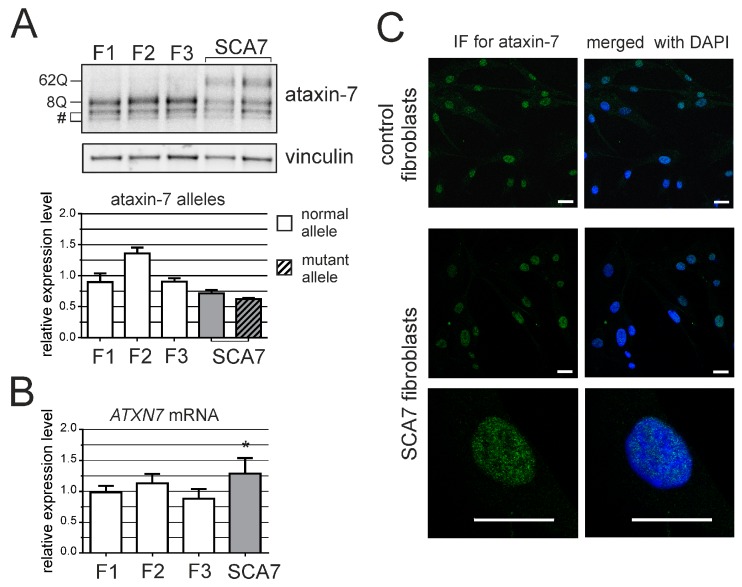
ATXN7 expression in human fibroblasts. (A) Western blot analysis of ataxin-7 levels in control (F1, F2 and F3) and spinocerebellar ataxia type 7 (SCA7) fibroblasts. Representative blot is shown and a graph presenting quantitation based on analyses from three separate protein isolations. In the case where the expression level of individual alleles was analyzed separately, clear bars represent normal allele and hatched bars represent mutant allele; (B) Quantitative Reverse transcription polymerase chain reaction (qRT-PCR) analysis of total ATXN7 mRNA levels in control and SCA7 fibroblasts; (C) Representative images of anti-ataxin-7 immunofluorescence (IF) in fibroblast cell lines (control: GM07492 and SCA7). Scale bar = 25 μm. 4′,6-diamidino-2-phenylindol (DAPI) staining of the nuclei is in blue.

