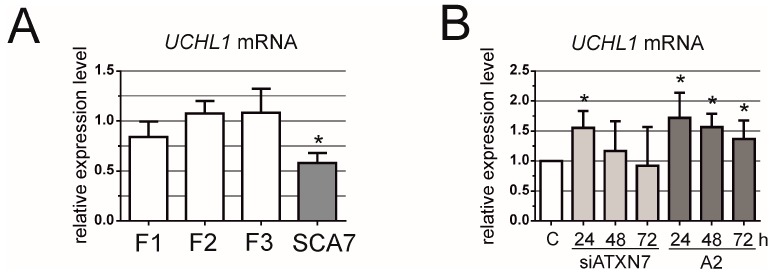
Figure 3.
Downstream effects of ATXN7 silencing. (A) qRT-PCR analysis of UCHL1 mRNA levels in control (F1, F2 and F3) and SCA7 fibroblasts; (B) qRT-PCR analysis of total ATXN7 mRNA levels in SCA7 fibroblasts for siATXN7 and A2 at 24, 48 or 72 h after transfection with 100 nM siRNAs. C—control line, SCA7 fibroblasts transfected with BlockIT siRNA. The error bars represent standard deviations. The p-value is indicated with an asterisk (* p < 0.05).

