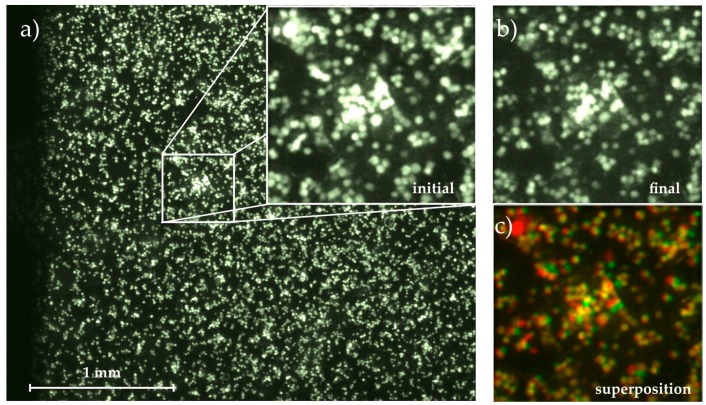
Figure 2.
Micrograph of the adhered cells on the substrate with magnification of (a) initial state at t0 = 0 min; and (b) final state at t = 60 min; (c) Superposition of both images using the colocalization finder macro for ImageJ [26]. Cells remaining fixed throughout the whole measurement are colored in yellow, detached cells are colored in red and moved or newly adhered cells are green.

