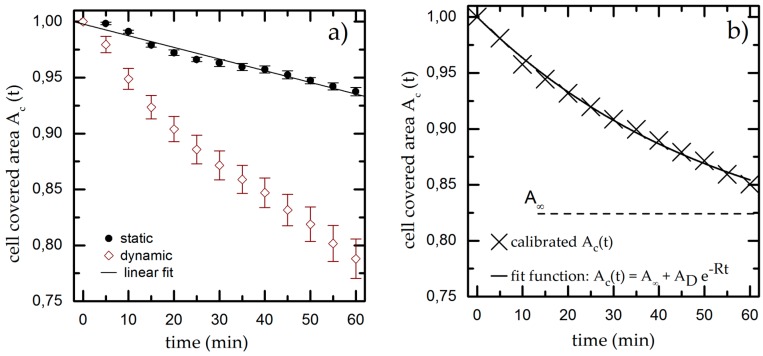
Figure 3.
(a) Cell covered area over time under static and dynamic conditions for T = 37 °C, pH = 7.4 and Rq = 3.76 µm. We fit a linear function to the static results (black line) and use it as calibration baseline to decouple the shear-induced detachment from the effects of gravity and bleaching. The data points and error bars show the mean and standard deviation respectively from n ≥ 5 measurements; (b) Dynamic measurement from (a) normalized to the linear fit extracted from the static experiments.

