
Figure 2.
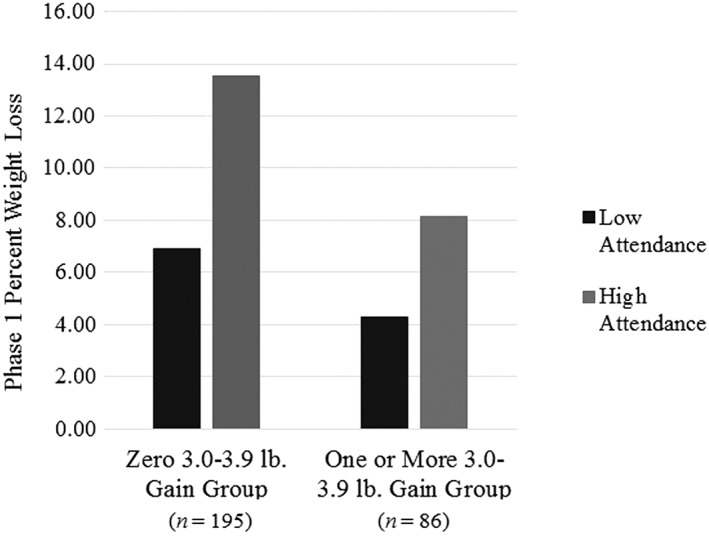
Interaction between 3.0 and 3.9 lb gain frequency group and attendance in predicting weight loss during Phase 1. Note. Low and high attendance reflect ±1 standard deviation, respectively.
Official websites use .gov
A
.gov website belongs to an official
government organization in the United States.
Secure .gov websites use HTTPS
A lock (
) or https:// means you've safely
connected to the .gov website. Share sensitive
information only on official, secure websites.
Interaction between 3.0 and 3.9 lb gain frequency group and attendance in predicting weight loss during Phase 1. Note. Low and high attendance reflect ±1 standard deviation, respectively.