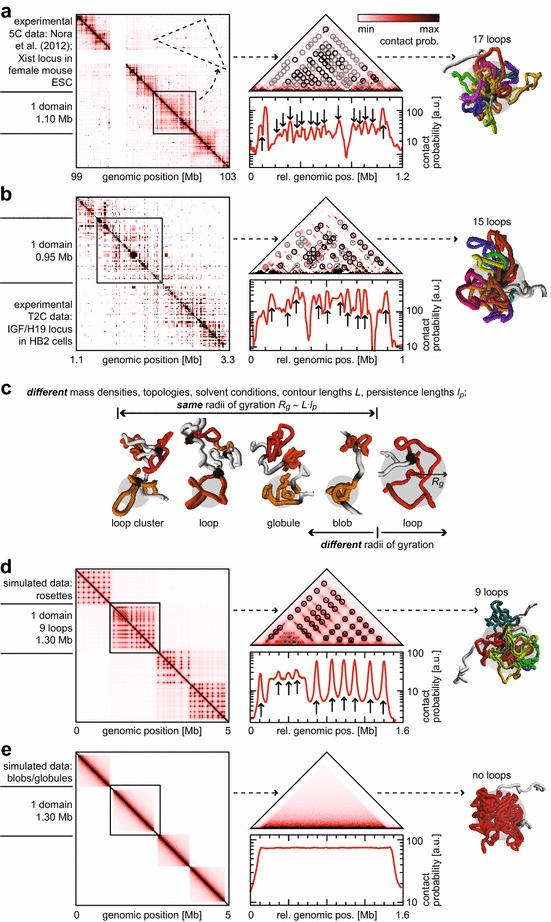
Fig. 1.

5C and T2C analysis and polymer modeling. a Genomic contact probability matrix for experimental 5C data [11]. The black square highlights a domain that is further studied. The dashed profile shows how the non-redundant triangular representation was extracted. We could identify loop bases (circles) with higher (black) or smaller (gray) significance. The 1D plot represents the global projection of the highlighted domain. Arrows indicate identified loop bases. The extracted loops allowed to simulate and visualize an exemplary configuration and to compute the R g. b Same as a, but for experimental T2C data [53]. c The different chromatin domain conformations probed in this study to model the FCS data: blob, globule, loop and loop cluster. The radius of gyration R g(gray circle) of domains depends on physical parameters, solvent conditions and the topology of the underlying chromatin fiber. It determines the characteristic time constants of internal relaxation kinetics observed in this study. d Same as a, but for a model configuration of the loop-cluster conformation under theta-solvent conditions (see Additional file 1: Supplementary Text). e Same as a, but for a model configuration of the globular conformation
