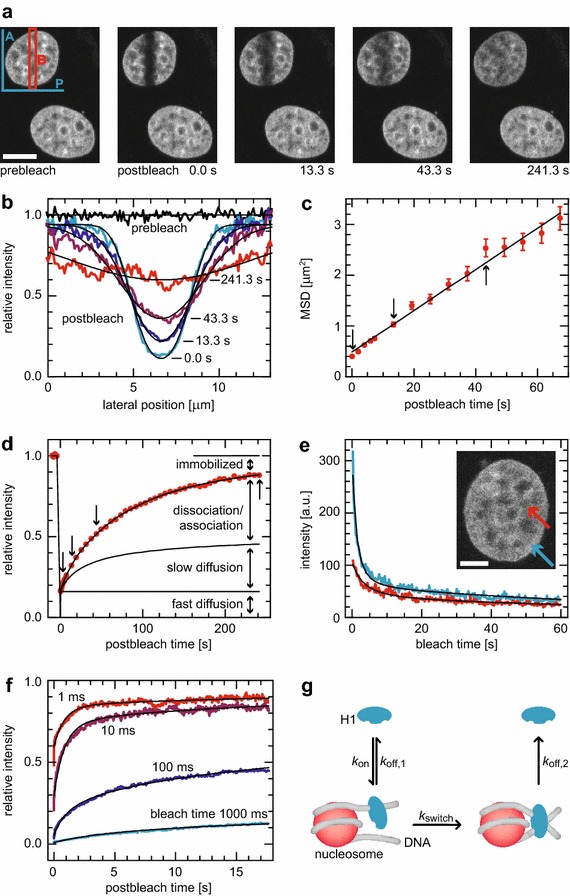
Fig. 3.

Photobleaching analysis of H1.0-chromatin binding. a Imaging FRAP experiment of H1-EGFP expressed in an MCF7 cell. Strip B (red) is bleached into the nucleus. The redistribution is followed over time and analyzed in different ways. b Averaging along the direction of the long strip dimension A (blue in a), plotting the profile perpendicularly in direction P and normalizing to the prebleach distribution (Additional file 1: Fig. S11) provided time-dependent profiles. They were fitted with Additional file 1: Eq. S91 to yield the MSD over time. c From a linear fit, apparent diffusion coefficients around 10−3 µm2 s−1 were extracted. d However, the apparent diffusion model, already comprising a fast reaction–diffusion scheme, did not explain exhaustively the intensity time trace obtained by averaging over the bleach region B in a. It required additional fast diffusive, transiently binding and immobilized fractions of the molecules for comprehensive modeling of the recovery data. However, a closed expression for a full reaction–diffusion scheme with two immobilization states cannot be derived. e We used continuous fluorescence photobleaching (CP), for which a closed expression with two bound states existed and which also allowed to address more specifically the localization types used in this study. This yielded a short-lived (residence time ~1 s) and a long-lived (~2 min) type of immobilization, whose fractions and detailed properties depended on localization and treatment of the cells with ATP or azide. f Globally fitting point FRAP experiments featuring bleach times series confirmed the CP and imaging FRAP results. g Resulting model of H1.0 binding: molecules bind to the DNA entry–exit sites of nucleosomes with rate k on. Either they rapidly dissociate again with rate k off,1, or they engage with rate k switch to the longer-lived conformation, from which they dissociate eventually with rate k off,2
