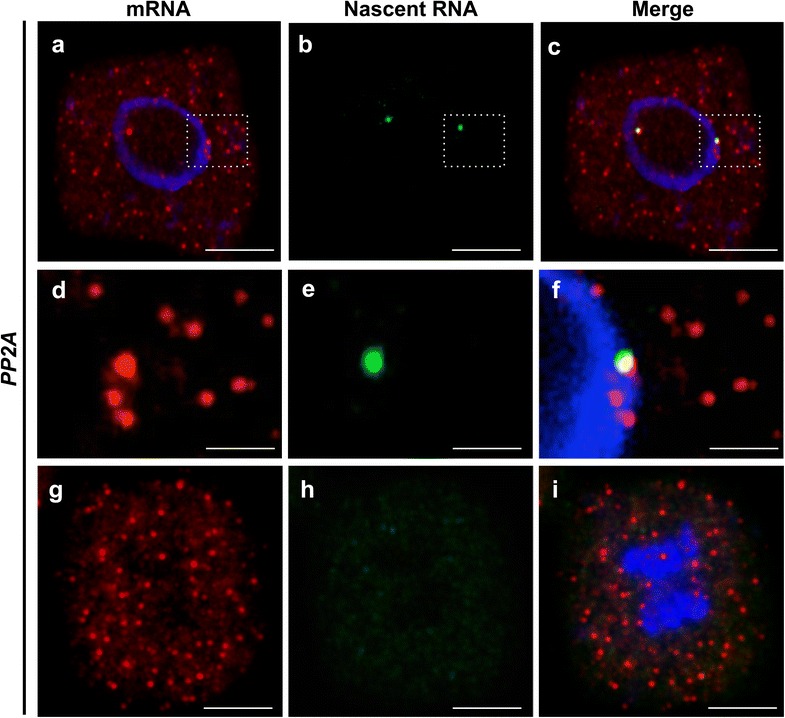
Fig. 3.

Simultaneous detection of spliced and nascent PP2A RNA. Representative images of cells labeled with PP2A mRNA (red) and nascent PP2A RNA (green). DNA labeled with DAPI (blue). a–c Representative image of an isolated meristem cell showing cytoplasmic mRNA (a); and two sites of active transcription located within the nucleus (b). d–f Magnified image from cell depicted in (a–c) showing co-localization of nascent PP2A RNA and mRNA. g–i Representative image of a cell during mitosis showing no transcription as judged by the absence of nascent RNA signals (h). Scale Bar = 10 μm in (a–c, g–i) and =0.5 μm in (d–f)
