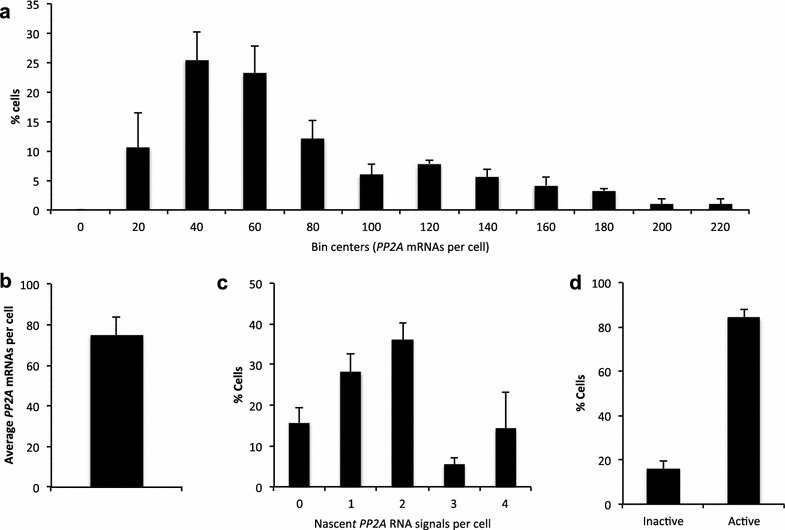
Fig. 6.

Quantification of mRNA and transcription status for PP2A. a Frequency distribution of mRNA molecules per cell. b Overall average mRNA number per cell. c Quantification of active PP2A transcription sites as judged by nascent RNA signals per cell. d Percentages of transcriptionally active versus inactive cells are shown in d. A total of 216 cells were analyzed. Error bars = +SEM
