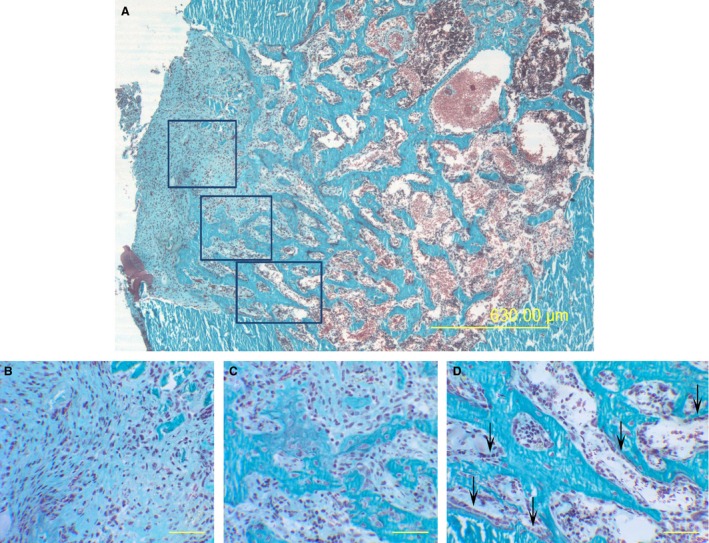
Figure 1.

Representative LM micrographs passing through the hole center, from a control rat 10 days after CBD: showing (A) from periosteal side (left) towards the endosteal one (right): highly vascularized connective tissue (enlarged in B), trabecular bony framework laid down by cords of stationary osteoblasts (enlarged in C), typical laminae of movable osteoblasts (arrows) differentiating on the surfaces of such SO‐trabeculae (enlarged in D). (B,C,D) Enlargements of the squared areas in (A). Scale bars: (A) 630 μm, (B,C,D) 50 μm.
