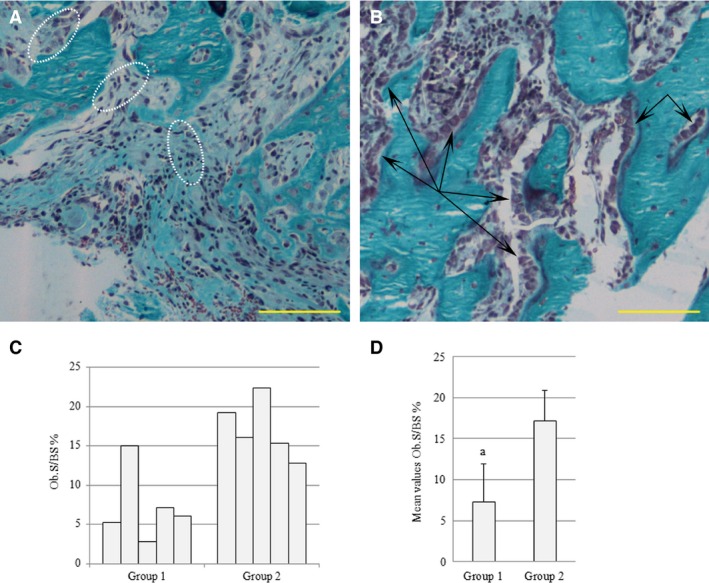
Figure 2.

Micrographs showing new bony trabeculae inside the hole in control (A) and treated (B) animals 10 days after CBD. The cords of static osteoblasts are encircled by dotted white lines (A); the laminae of movable osteoblasts are indicated by black arrows (B). (C) Histogram reporting the values of the extent of the surface of prismatic osteoblast laminae with respect to the bone surface (Ob.S/BS) in the drilled control (group 1) and the drilled animals treated with PTH(1‐34) (group 2), 10 days after CBD. (D) Histogram reporting mean values for the same parameter; a = P < 0.05. Scale bars: (A,B) 100 μm.
