Abstract
Multiple sclerosis (MS) is a chronic neurological disorder that affects the central nervous system (CNS), and results in CNS inflammation and damage to myelin. In this study, we examined the possible synergistic effects of C16, angiopoietin‐1 (Ang‐1) and regeneration gene protein 2 (Reg‐2) in alleviating inflammation in an acute experimental autoimmune encephalomyelitis (EAE) model. We employed multiple histological, morphological and iconographic assays to examine the effect of those drugs on disease onset, clinical scores and behavioral deficits. Our results demonstrated that triple combination therapy was more efficient than the monotherapy in EAE treatment. The triple therapy significantly delayed the onset of motor symptoms, reduced disease severity, attenuated inflammatory cell infiltration and suppressed the secretion of proinflammatory cytokines. Additionally, treatment increased anti‐inflammatory cytokines expression, inhibited reactive astrocytes proliferation, reduced demyelination and axonal loss, and finally reduced the neural death. Specifically, Reg‐2 administration rescued oligodendrocytes and neuronal axons mainly by direct neurotrophic effects, while C16+Ang‐1 (C+A) mainly improved the inflammatory milieu. In conclusion, our study suggests a possible synergistic effect through targeting a variety of pathways in relieving the clinical symptoms of inflammation in acute EAE model. Therefore, using molecules that target different molecular pathways can be beneficial for exploring novel therapeutic approaches for MS treatment.
Keywords: angiopoietin‐1, C16, complementary effects, encephalomyelitis, regeneration gene protein 2
Introduction
Multiple sclerosis (MS) is a chronic inflammatory disease of the central nervous system (CNS) in which circulating leukocytes enter the brain and spinal cord producing inflammation, myelin damage and paralysis (Fang et al. 2013b; Han et al. 2013). MS is thought to affect more than 2.5 million individuals worldwide. MS is a major cause of non‐traumatic disability in young adults with no cure available. Certain anti‐inflammatory drugs and immunomodulatory drugs have become the primary focus in the treatment of MS. Those drugs aim to reduce the disease activity and improve the clinical course either by modulating or suppressing the immune system. Immunomodulators including interferon‐β1a and ‐β1b, glatiramer acetate and fingolimod are routinely utilized. Immunosuppressant medications used in treatment include mitoxantrone, natalizumab, teriflunomide, dimethyl fumarate, alemtuzumab, azathioprine, cyclophosphamide and cladribine (Gajofatto et al. 2015). However, adverse effects associated with immunosuppression as well as low efficacy and tolerability are major drawbacks for the aforementioned MS treatments (Fang et al. 2013b).
To date, experimental autoimmune encephalomyelitis (EAE) is the only experimental rodent model that reflects the pathological and clinical features of MS (Baker & Amor, 2014). Angiopoietin‐1 (Ang‐1), C16 and regeneration gene protein 2 (Reg‐2) are therapeutic agents that target different signaling pathways. Each individual treatment was previously shown to have beneficial effects in an acute EAE model (Fang et al. 2011b; Jiang et al. 2014; Wang et al. 2015). Daily intravenous injection of C16 in rodents, an αvβ3 integrin‐binding peptide, promoted recovery and reduced relapse in an acute EAE model (Fang et al. 2013b; Zhang et al. 2014). We observed that C16 could interfere with leukocyte ligands required for lymphocytes transmigration, as well as alleviating the extensive infiltration of leukocytes and macrophages in the spinal cord and brain (Han et al. 2010). In addition, Ang‐1 is an endothelial growth factor that reduces vascular permeability and alleviates blood vessel leakiness under inflammatory conditions, and hence improves the clinical symptoms of EAE. Finally, Reg‐2 is a peptide with neuroprotective effects similar to ciliary neurotrophic factor (CNTF). We previously reported that Reg‐2 acts as a neuroprotective agent by reducing spinal cord secondary injury, promoting axonal growth, decreasing cell death and demyelination area, and improving functional recovery following spinal cord injury (Fang et al. 2011b).
Therefore, in the current study, we examined the combination of the administration of all three drugs in order to examine the possible synergistic effects in the treatment of an acute EAE model.
Materials and methods
Animals and EAE induction
A total of 102 adult male Lewis rats, weighing 250–300 g, were obtained from the Laboratory Animal Services Centre of the Zhejiang University. Fourteen rats were used as the normal control group, and the remaining 88 rats were randomly assigned into four groups (n = 22 in each group):
the vehicle control‐treated group;
Reg‐2‐treated group: 200 μg was administered intrathecally (i.t.) (Shanghai Science Peptide Biological Technology, Shanghai, China);
C16‐ and Ang‐1‐treated group: 1 mL mixture containing 2 mg C16 + 400 μg Ang‐1/per day was administered intravenously (i.v.) (C+A; Shanghai Science Peptide Biological Technology);
C16 + Ang1 + Reg‐2 (C+A+R)‐treated group: a combination of the three agents was administered.
EAE was induced in both drug‐ and vehicle‐treated rats via a subcutaneous injection at the nuchal midline of 0.2 mL guinea pig spinal cord homogenate (GPSCH), which was emulsified in 1 : 1 ratio with complete Freund adjuvant (CFA; Sigma‐Aldrich, St Louis, MO, USA), containing 0.5 mg of heat‐killed Mycobacterium tuberculosis (Difco Laboratories, Detroit, MI, USA). Rats in the normal control group were injected with CFA emulsified 1 : 1 with 0.9% saline. Immediately thereafter, and again 48 h later, each rat received an intraperitoneal injection of 300 ng Pertussis toxin in 0.1 mL distilled water (Sigma‐Aldrich).
Beginning on the day of EAE induction, rats were assessed for clinical signs of disease on a daily basis. Disease severity was assessed using a scale ranging from 0 to 5: grade 0 = no signs; grade 1 = partial loss of tail tonicity; grade 2 = loss of tail tonicity; grade 3 = unsteady gait and mild paralysis; grade 4 = hind limb paralysis and incontinence; and grade 5 = moribund or death (Yu et al. 2010). Animal scoring was continued until the time of death, and clinical symptoms were scored by observers blind to experimental treatments.
All animal procedures used in this study were carried out in accordance with the National Institute of Health Guide for the Care and Use of Laboratory Animals. The study was approved by the animal ethics committee of Zhejiang University.
Preparation of osmotic pumps and drug delivery
Reg‐2 and vehicle (0.9% saline) were delivered continuously via implanted Alzet osmotic minipumps for 2 weeks (pump model 2002; 0.5 μL h−1; ALZET Osmotic Pumps, Cupertino, CA, USA). All the osmotic minipumps were implanted immediately after receiving EAE induction (GPSCH‐CFA and the first Pertussis toxin injection). Before implantation, 66 osmotic minipumps were prepared under sterile conditions and filled with phosphate‐buffered saline (PBS; n = 22 for the vehicle‐treated group) and Reg‐2 in saline (n = 44 rats, 22 rats for the Reg‐2‐treated group and 22 rats for C+A+R‐treated group). Cannulae consisting of polyurethane tubing were sterilized overnight in 100% ethanol before being attached to the flow moderator of the pump. Pumps were incubated overnight at room temperature in sterile saline for priming. Under an operating microscope, the tabs on the top of the cannula were attached to the electrode holder of astereotaxic apparatus, and the catheters were introduced into the cerebral ventricle through small holes in the skull, according to the manufacturer's instructions (Alzet Brain Infusion Kit, Cupertino, CA, USA). The infusion was started immediately. Anchoring screws were secured with dental cement, and the pump was placed in a subcutaneous pocket. The scalp wound was closed in layers, and rats were placed in temperature‐ and humidity‐controlled chambers overnight for recovery. Penicillin was injected intramuscularly (25 000 UI per rat).
Intravenous injection of C16
C16 peptide (KAFDITYVRLKF) was dissolved in distilled water with 0.3% acetic acid. The peptide solution was sterilized through a 0.22‐μm disc filter and neutralized with NaOH. This solution was buffered by adding an equal volume of sterile PBS, and diluted to a final concentration of 4 mg mL−1. Ang‐1 peptide (Shanghai Science Peptide Biological Technology) was also dissolved in distilled water to a final concentration of 800 μg mL−1. We injected Ang‐1 400 μg day−1 and C16 2 mg day−1 by i.v. injections into the tail vein every day for 2 weeks in C16+Ang1 (C+A) and C16+Ang1+Reg‐2 (C+A+R) groups. The first dose was given immediately after EAE induction.
Neurophysiological testing
Cortical somatosensory‐evoked potentials (c‐SEPs) were recorded at 1 week (the onset stage of vehicle‐treated group), 2 weeks (the peak stage of vehicle‐treated group) and 8 weeks post‐immunization (Pi, the recovery stage of vehicle‐treated group) for five rats in each group just before the animals were killed. Mice were fixed into a stereotaxic frame and the surgical processes were performed as detailed previously (Zhang et al. 2014). SEPs were amplified, filtered, digitally converted and stored for post hoc analysis. Values obtained by the three series of stimulations were processed by statistical analyses. Peak positive and negative values were measured, and results were expressed as the mean ± SEM of voltage amplitude (μV) and latency (ms; Troncoso et al. 2000; Devaux et al. 2003; All et al. 2009).
Cortical motor‐evoked potentials (c‐MEP) were performed at the same time points as c‐SEPs. Following anesthesia, a midline incision was made on the skin of the cranium, the tissues underneath were cleaned and the cranium was exposed. Screw electrodes were implanted to a depth of 0.75 mm over the primary somatomotor cortical areas, lightly in contact with the dura mater without excessive pressure or perforation. A reference electrode was inserted 2 mm away from the screw electrode. The sensorimotor cortex stimulated at 10 Hz with trains of 10–25 pulses (1 ms, 1 mA) evoked a visible contralateral hind limb movement, and signals were averaged for obtaining a c‐MEP (Bolay et al. 2000; Amadio et al. 2006). Neurophysiological examinations were performed by investigators blind to clinical scores and treatment groups.
Perfusion and tissue processing
Animals from each group were killed after 2 or 8 weeks Pi (five rats per time point in each group). Rats were anesthetized with sodium pentobarbital, and perfused intracardially with cold saline followed by 4% paraformaldehyde in 0.1 m phosphate buffer (PB; pH 7.4). The spinal cord and brain tissues were carefully dissected. One centimeter of the lumbar spinal cord and half of the brain of each animal were fixed in the same fixative for 4 h and cryoprotected into 30% sucrose in PBS. Twenty‐micron‐thick sections were cut on a freezing microtome through the coronal plane of the brain and transverse plane of the spinal cord using a Leica cryostat, and then mounted onto 0.02% poly‐l‐lysine‐coated slides. All sections were collected for histological assessment, immunohistological and immunofluorescent staining. The rest of the CNS tissues were fixed in 2.5% glutaraldehyde solution and examined by transmission electron microscope.
Histological assessment
Cresyl violet (Nissl) staining was employed to assess inflammation and neuron survival. Neuron counts from both spinal cord anterior horns were performed, and were restricted to neurons with a well‐defined nucleolus and cell body with adequate amounts of endoplasmic reticulum. Digital images were collected using a Nikon TE‐300 microscope in three visual fields/per section with 200 × magnification under brightfield viewing. An assessment of inflammatory cell infiltration severity was conducted by analyzing the following scale: 0, no inflammation; 1, cellular infiltration only around blood vessels and meninges; 2, mild cellular infiltration in the parenchyma (1–10 per section); 3, moderate cellular infiltration in the parenchyma (11–100 per section); and 4, serious cellular infiltration in the parenchyma (> 100 per section), as previously described (Ma et al. 2010).
Luxol fast blue (LFB) staining was used to evaluate the degree of demyelination. Sections were immersed in graded ethanol solutions and placed in a 0.1% LFB solution for 1.5 h at 65 °C. Sections were then placed in ethanol and differentiated for 15–20 min in 0.05% lithium carbonate. Finally, sections were dehydrated in graded series of ethanol, immersed in xylene, mounted, and covered with coverslips. Digital photomicrographs were obtained at 40 × magnification. Demyelination was scored as follows: 0, normal white matter; 1, rare foci; 2, a few areas of demyelination; 3, confluent perivascular or subpial demyelination; 4, massive perivascular and subpial demyelination involving half of the spinal cord with the presence of cellular infiltrates in the CNS parenchyma; and 5, extensive perivascular and subpial demyelination involving the whole cord section with the presence of cellular infiltrates in the CNS parenchyma (Yin et al. 2010).
Bielschowsky silver staining was performed as previously described to estimate axonal loss (Fang et al. 2013b; Han et al. 2013; Zhang et al. 2014). Axonal loss was assessed using the following scale: 0, no axonal loss; 1, a few foci of superficial axonal loss involving less than 25% of the tissue; 2, foci of deep axonal loss that encompassed over 25% of the tissue; and 3, diffuse and widespread axonal loss (Yin et al. 2010).
Assessment of blood–brain barrier (BBB) disruption by Evans blue extravasation
At 2 and 8 weeks Pi, rats (n = 3 per group) were randomly selected for assessment of BBB vascular permeability with a modified Evans blue extravasation method. Briefly, rats were anesthetized with sodium pentobarbital (60 mg kg−1, i.p.) and infused with 37 °C Evans blue dye (2% in 0.9% normal saline, 4 mL kg−1) via the right femoral vein for 5 min. Two hours later, the rats were perfused with 300 mL normal saline to wash out any remaining dye in the blood vessels. BBB permeability was then evaluated in the brain motor cortex and spinal cord tissue. Half of the tissues were removed, isolated and mechanically homogenized in 750 μL of N,N‐dimethylformamide (DMF; Sigma, St Louis, MO, USA). The suspension obtained was maintained at room temperature in the dark for 72 h. The suspension was then centrifuged at 10 000 g for 25 min, and the supernatant was analyzed with a spectrophotometer (Molecular Devices OptiMax, USA) at 610 nm. Dye concentrations were expressed as μg g−1 of tissue weight and calculated from a standard curve obtained from known amounts of the dye (Jiang et al. 2014). The remaining tissue was sectioned at 20 μm thickness for digital imaging.
Immunohistochemical staining
Slides were warmed for 20 min on a slide warmer, and a ring of wax was applied around the sections with a PAP pen (Invitrogen, Carlsbad, CA, USA). After rinsing in 0.01 m Tris‐buffered saline (TBS) for 10 min, sections were permeabilized and blocked with 0.3% Triton X‐100/10% normal goat serum in 0.01 m PBS for 30 min, then incubated with the following polyclonal rabbit antibodies: anti‐Olig1 (1 : 500; Santa Cruz, Dallas, TX, USA), anti‐NF‐κB p65 (1 : 500; Abcam, MA, USA), anti‐cyclooxygenase‐2 (COX‐2; 1 : 1000; BioVision, Milpitas, CA, USA) and anti‐TNF‐α (1 : 1000; ProSci, CA, USA) overnight at 4 °C. The process of immunohistochemical staining was performed as described previously (Jiang et al. 2014; Zhang et al. 2014). Negative controls obtained by omitting the primary antibody were used in order to confirm the specificity of immunohistochemical labeling. Five sections from the motor cortex and anterior horns of the spinal cord per animal were randomly selected, and images were photographed under 200 × magnification in three visual fields per section, the numbers of caspase‐3‐ and Olig1‐labeled cells were counted.
Immunofluorescence staining
Sections were pretreated as described above, incubated with monoclonal mouse anti‐ growth‐associated protein (GAP43; 1 : 200), anti‐neurofilament M (NF‐M; 1 : 500; United States Biological, MA, USA), anti‐CD68/ED1 (1 : 100; Santa Cruz) antibodies and polyclonal rabbit anti‐glia fibrillary acidic protein (GFAP; 1 : 200; Thermo Fisher Scientific, Waltham, MA, USA), anti‐caspase 3 (1 : 500; Cayman Chemical, Ann Arbor, MI, USA) and anti‐myelin basic protein (MBP; 1 : 500; Abcam) overnight at 4 °C, then washed with PBS and incubated with FITC‐conjugated goat anti‐rabbit IgG secondary antibodies (1 : 200 dilution) for 1 h at 37 °C (Invitrogen). Sections were mounted with anti‐fade Gel/Mount aqueous mounting media (Southern Biotech, AL, USA). All control sections were incubated in PBS without primary antibodies. Areas that exhibited immunoreactivity to GFAP were analyzed with nih image software.
Processing for electron microscopy
Detection of neural apoptosis, axonal loss as well as the quantification of thinly myelinated axons, representing re‐myelinated axons, was performed by electron microscopy in different regions of the CNS. Tissues fixed with 2.5% glutaraldehyde were washed three times with 0.1 m PB. Post‐fixed tissues were placed in 1% osmium tetroxide overnight at 4 °C and then washed three times with 0.1 m PB. Processing for electron microscopy was performed as previously described (Fang et al. 2013b; Han et al. 2013; Zhang et al. 2014). Briefly, thin sections were cut, stained with uranyl acetate and lead citrate, and then the electron micrographs were analyzed for fiber diameter, myelin thickness and axon diameter using the scion Imaging software. One‐hundred fibers (> 0.3 μm in diameter) from each animal were analyzed, with five rats being used at each time point. A G‐ratio was calculated for each myelinated fiber, and then the average from all the G‐ratio values from the brain and spinal cord were calculated. The G‐ratio is the axon diameter divided by the diameter of the myelinated axons (Mason et al. 2001). Finally, the mean of the G‐ratios from the five samples was determined. All histological assessments were performed by investigators blinded to the clinical scores.
Cytokine quantification by enzyme‐linked immunosorbent assay (ELISA)
Peripheral blood samples were collected from rats that were killed by decapitation at weeks 2 and 8 Pi (n = 3 per time point for each group). ELISAs for TGF‐β (R&D System, Minneapolis, MN, USA), and IFN‐γ (BioLegend, San Diego, CA, USA) were performed as previously described (Han et al. 2013; Zhang et al. 2014). Optical density was measured at 450 nm and analyzed using graphpad prism 4 (GraphPad Software, San Diego, CA, USA).
Western blotting
Rats were killed by decapitation at weeks 2 and 8 Pi (n = 3 rats/time point in each group), and whole brain tissue and 10‐mm lumbar spinal cord segments were dissected. Total protein lysates were extracted from the brain and the intact spinal cord in 1 mL EDTA‐free ice‐cold RIPA buffer. Western blot analysis was performed as described previously (Han et al. 2013; Zhang et al. 2014). Membranes were incubated for 12 h at room temperature with the following primary antibodies: rabbit polyclonal anti‐NFkB (1 : 500), anti‐COX‐2 (1 : 2000), anti‐TNF‐α (1 : 1000) and mouse anti‐GAP‐43 (1 : 2000) antibodies. Primary antibodies were omitted in negative controls.
Statistical analysis
Kruskal–Wallis non‐parametric analysis was used for data presented as percentages. The differences between clinical scores and histological scores were analyzed with Mann–Whitney tests. All data were analyzed in spss 13.0 software, and P‐values less than 0.05 were considered to be statistically significant. All statistical graphs were created in graphpad prism Version 4.0.
Results
C+A‐, Reg‐2‐ and C+A+R‐treatments reverse electrophysiological dysfunction in EAE rats, postpone the onset of motor symptoms, and reduce disease severity
In vehicle‐treated rats, functional scoring demonstrated that the onset of disease symptoms (Score > 2) was observed at week 1 Pi, and the acute phase of the disease began with a sharp increase in the severity of motor symptoms (average clinical score of 3.0–4.0), which peaked at week 2 Pi (Fig. 1). Clinical scores gradually declined and acute EAE underwent a spontaneous recovery. At 8 weeks Pi, the clinical scores of vehicle‐treated rats returned to a level ranging from 1.5 to 2. Animals treated with C+A, Reg‐2 and C+A+R showed a similar disease course to that of the vehicle group, but all three groups displayed clinical signs of delayed onset and reduced severity. In Reg‐2‐treated groups, clinical scores at each time point except for the peak stage were remarkably lower than that of the vehicle‐treated controls. The C+A+R‐treated rats exhibited lower clinical scores relative to those of the C+A‐ and Reg‐2‐treated rats at each time point, and were significantly lower than that of the vehicle group at the peak stage (4 weeks Pi, P < 0.05; Fig. 1). Moreover, the clinical scores in the C+A‐ and C+A+R‐treated rats were significantly lower than those of the Reg‐2‐treated group at 1–2 weeks Pi (&P < 0.05; Fig. 1). In the C+A+R group, the clinical scores were significantly lower than the Reg‐2‐treated group at each time point, except for 8 weeks Pi. At 7 weeks Pi, the clinical score of the C+A+R group was significantly lower than the C+A group (#P < 0.05; Fig. 1).
Figure 1.
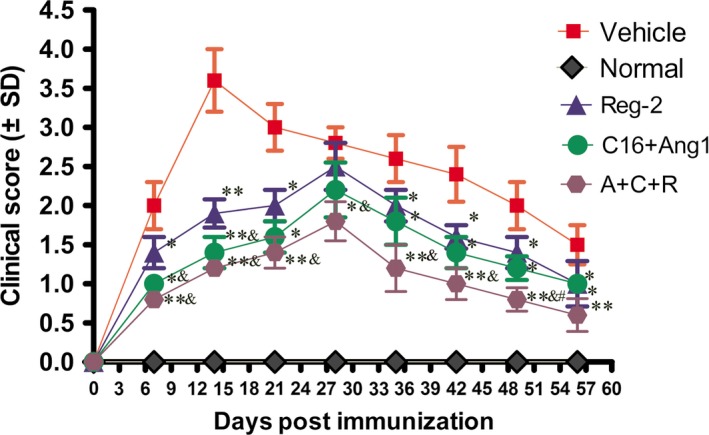
Combination treatment of C16, Ang1 and Reg‐2 improves the clinical progression of EAE. Clinical progression of EAE was attenuated after treatment with C+A, Reg‐2 and C+A+R, as measured by disease scoring (n = 11 in each group). *P < 0.05 vs. vehicle‐treated group at the same time point. **P < 0.01 vs. vehicle‐treated group at the same time point. The onset stage of EAE symptoms in the vehicle group was 1 week Pi, and peaked at 2 weeks Pi. However, a significant delay in the onset of clinical signs and postponing the peak stage of EAE symptoms were observed in C+A‐, Reg‐2‐ and C+A+R‐treated groups. Moreover, the clinical scores were lower in the C+A+R‐treated group than in the other two groups. The clinical scores in the C+A‐ and C+A+R‐treated rats were significantly lower than those of the Reg‐2‐treated group at 1–2 weeks Pi (&P < 0.05). At 7 weeks Pi, the clinical score of the C+A+R group was lower than in the C+A group (#P < 0.05) vs. C+A‐treated EAE rats, Scoring was performed by observers blind to the treatment groups.
EAE induction increased the latency to waveform initiation and decreased peak amplitude in both c‐SEP (Tables 1, 2, 3) and MEP (Tables 4, 5, 6) recordings. However, application of C+A, Reg‐2 and C+A+R treatments significantly reduced the severity of these electrophysiological disturbances by reducing disease‐associated delays in latency, which can be related to the speed of conduction, and reversing the decrease in amplitude related to the number of surviving fibers (Fig. S1). In addition, the effects were more pronounced in the C+A+R‐treated group than in the other two groups.
Table 1.
Reg‐2, C16 and Ang‐1 treatment reduced c‐SEP latencies and increased c‐SEP amplitudes
| 1 week Pi | Latency (ms) | ||
|---|---|---|---|
| Group | N | P | Wave amplitude (μV mean ± SD) |
| Normal | 15.13 ± 0.27a | 19.56 ± 0.18b | 13.29 ± 1.98b |
| Vehicle | 22 ± 0.85 | 29.38 ± 0.45 | 1.47 ± 0.53 |
| Reg‐2 | 20.12 ± 0.14 | 23.4 ± 0.73 | 7.89 ± 0.45b |
| C+A | 16.78 ± 0.25a | 21 ± 0.5a | 9.5 ± 1.21b |
| C+A+R | 14.8 ± 0.13a | 19.52 ± 0.11b | 13.85 ± 0.79b |
N, negative deflection; P, positive deflection.
P < 0.05 vs. vehicle‐treated EAE rats at 1 week Pi.
P < 0.01 vs. vehicle‐treated EAE rats.
Table 2.
Reg‐2, C16 and Ang‐1 treatments reduced c‐SEP latencies and increased c‐SEP amplitudes
| 2 weeks | Latency (ms) | ||
|---|---|---|---|
| Group | N | P | Wave amplitude (μV mean ± SD) |
| Normal | 15.3 ± 0.34a | 20.35 ± 0.31b | 15.76 ± 2.44b |
| Vehicle | 23.5 ± 0.61 | 28.99 ± 0.57 | 4.36 ± 0.48 |
| Reg‐2 | 17.3 ± 0.39a | 20.64 ± 0.33b | 8.23 ± 0.78b |
| C+A | 16.2 ± 0.89a | 19.22 ± 1.1b | 8.1 ± 0.35b |
| C+A+R | 15.53 ± 0.65a | 20.88 ± 0.09b | 14.92 ± 1.23b |
N, negative deflection; P, positive deflection.
P < 0.05 vs. vehicle‐treated EAE rats at 2 weeks post‐immunization.
P < 0.01 vs. vehicle‐treated EAE rats.
Table 3.
Reg‐2, C16 and Ang‐1 treatments reduced c‐SEP latencies and increased c‐SEP amplitudes
| 8 weeks | Latency (ms) | ||
|---|---|---|---|
| Group | N | P | Wave amplitude (μV mean ± SD) |
| Normal | 17.2 ± 0.23a | 19.67 ± 0.10b | 21.76 ± 1.44b |
| Vehicle | 23.45 ± 0.34 | 29.65 ± 0.21 | 4.36 ± 1.01 |
| Reg‐2 | 17.68 ± 0.35a | 20.12 ± 0.56b | 8.91 ± 1.23b |
| C+A | 16.24 ± 0.27a | 19.48 ± 0.45b | 9.23 ± 0.88b |
| C+A+R | 15.79 ± 0.99b | 20.32 ± 0.67b | 20.33 ± 0.78b |
N, negative deflection; P, positive deflection.
P < 0.05 vs. vehicle‐treated EAE rats at 8 weeks post‐immunization.
P < 0.01 vs. vehicle‐treated EAE rats.
Table 4.
Reg‐2, C16 and Ang‐1 treatments reduced MEP latencies and increased c‐MEP amplitudes at 1 week post‐immunization
| 1 weeks Pi | Latency (ms) | |
|---|---|---|
| Group | Wave amplitude (μV mean ± SD) | |
| Normal | 4.83 ± 0.33a | 9.12 ± 0.49b |
| Vehicle | 6.21 ± 0.36 | 0.12 ± 0.09 |
| Reg‐2 | 5.57 ± 0.42 | 2.59 ± 0.42a |
| C+A | 4.9 ± 1.1a | 4.65 ± 0.47a |
| C+A+R | 4.87 ± 0.3a | 5.92 ± 0.16b |
P < 0.05 vs. vehicle‐treated EAE rats.
P < 0.01 vs. vehicle‐treated EAE rats.
Table 5.
Reg‐2, C16 and Ang‐1 treatments reduced MEP latencies and increased c‐MEP amplitudes at 2 weeks post‐immunization
| 2 weeks | Latency (ms) | |
|---|---|---|
| Group | Wave amplitude (μV mean ± SD) | |
| Normal | 4.92 ± 0.11b | 7.1 ± 0.5b |
| Vehicle | 10.12 ± 0.22 | 0.1 ± 0.09 |
| Reg‐2 | 5.57 ± 1.22b | 1.34 ± 0.94a |
| C+A | 5 ± 0.61b | 4.87 ± 0.42a |
| C+A+R | 5.05 ± 0.6b | 5.34 ± 0.45b |
P < 0.05 vs. vehicle‐treated EAE rats.
P < 0.01 vs. vehicle‐treated EAE rats.
Table 6.
Reg‐2, C16 and Ang‐1 treatments reduced MEP latencies and increased c‐MEP amplitudes at 8 weeks post‐immunization
| 8 weeks | Latency (ms) | |
|---|---|---|
| Group | Wave amplitude (μV mean ± SD) | |
| Normal | 5.12 ± 0.21a | 7.65 ± 0.33b |
| Vehicle | 7.03 ± 0.41 | 0.23 ± 0.07 |
| Reg‐2 | 5.4 ± 0.35a | 3.38 ± 0.44a |
| C+A | 4.54 ± 0.18a | 4.17 ± 0.59a |
| C+A+R | 5.11 ± 0.75a | 7.12 ± 0.62b |
P < 0.05 vs. vehicle‐treated EAE rats.
P < 0.01 vs. vehicle‐treated EAE rats.
C+A, Reg‐2 and C+A+R treatments attenuate perivascular/parenchymal infiltration and reduce CNS inflammation
In the vehicle‐treated rats, immunostaining for CD68+ (a marker for extravasated macrophages) at the peak stage of acute EAE (2 weeks Pi), showed diffuse infiltration of inflammatory cells that appeared in the CNS not only around blood vessels, but also throughout the brain and spinal cord parenchyma and beneath the meninges (Fig. 2B). However, less severe perivascular and parenchymal inflammatory cell infiltration was observed in Reg‐2‐ (Fig. 2C) and C+A (Fig. 2D,E)‐treated EAE rats, and significantly less infiltration was noted in the C+A+R‐treated rats (Fig. 2F). Moreover, the inflammatory scores of the C+A‐, Reg‐2‐ and C+A+R‐treated groups were also significantly lower than those of the vehicle‐treated EAE group at both 2 and 8 weeks Pi. This decrease was particularly prominent in C+A+R‐treated EAE rats (Fig. 2G,H).
Figure 2.
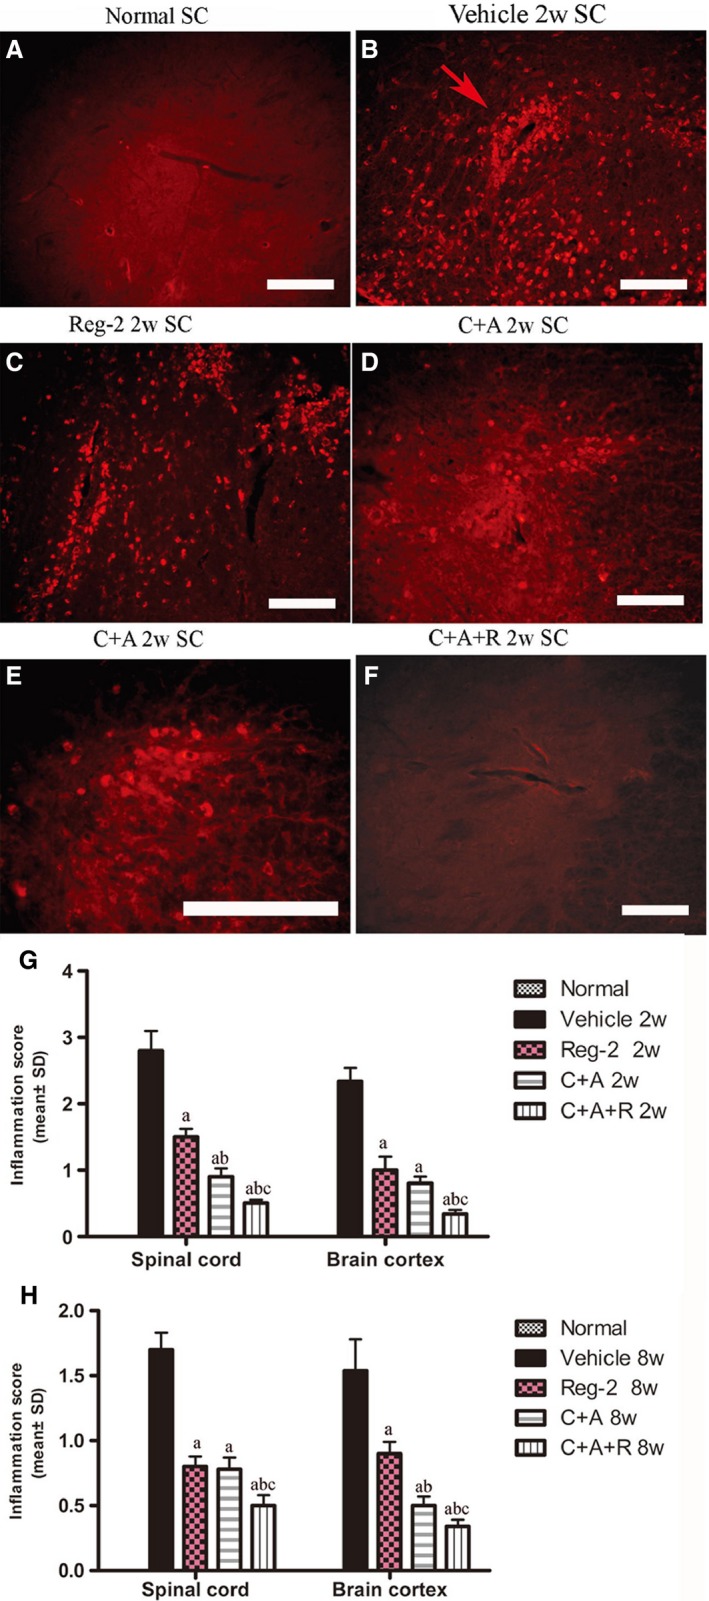
At 2 weeks Pi, infiltration of inflammatory CD68+ (a marker for extravasated macrophages) cells (B) was observed surrounding blood vessels and in the parenchyma of spinal cord in vehicle‐treated EAE rats. The C+A and Reg‐2, and especially the C+A+R, applications could evidently alleviate this phenomenon. CD68 immunofluorescence staining, scale bar: 100 μm. (E) is the regional magnification of (D), which showed the morphological feature of macrophages. The arrow in (B) shows the infiltrated inflammatory cells surrounding blood vessels as ‘perivascular cuffing’. SC, transverse sections through the anterior horn of the lumbar spinal; BC, coronal sections of the motor cortex. (G,H) C16, Ang1 and Reg‐2 treatment attenuated CNS inflammation at (G) 2 and (H) 8 weeks Pi, as shown by inflammation scoring. (a) P < 0.05 vs. vehicle‐treated EAE rats; (b) P < 0.05 vs. Reg‐2‐treated EAE rats; (c) P < 0.05 vs. C+A‐treated EAE rats.
C16, Ang1 and Reg‐2 treatments all could reduce demyelination and axonal loss in the CNS following EAE induction, and C+A+R treatment was the most effective
Luxol fast blue staining and MBP, a marker of axonal myelination, immunohistochemical labeling were used to assess myelination in each group. Vehicle‐treated EAE rats displayed large areas of demyelization (Figs 3D–F and S2B,C) when compared with that of normal rats at 2 weeks Pi (Figs 3A–C and S2A). Treatment with Reg‐2 visibly reduced the areas of demyelination (Figs 3G–I and S2D). Furthermore, both MBP immunohistochemical staining and LFB staining revealed that both C+A‐ and C+A+R‐treated groups exhibited greater areas of myelination vs. the vehicle‐treated rats (Figs 3J–O and S2E,F), and the C+A+R treatment exhibited markedly greater myelination than the other two groups (Figs 3M–O and S2F). Moreover, C16+ Ang1 and Reg‐2 treatments notably reduced demyelization scores (Fig. S2G,H) at both 2 and 8 weeks Pi. Again, greater effects were observed in the C+A+R‐treated rats than in the other two groups (Fig. S2G,H).
Figure 3.
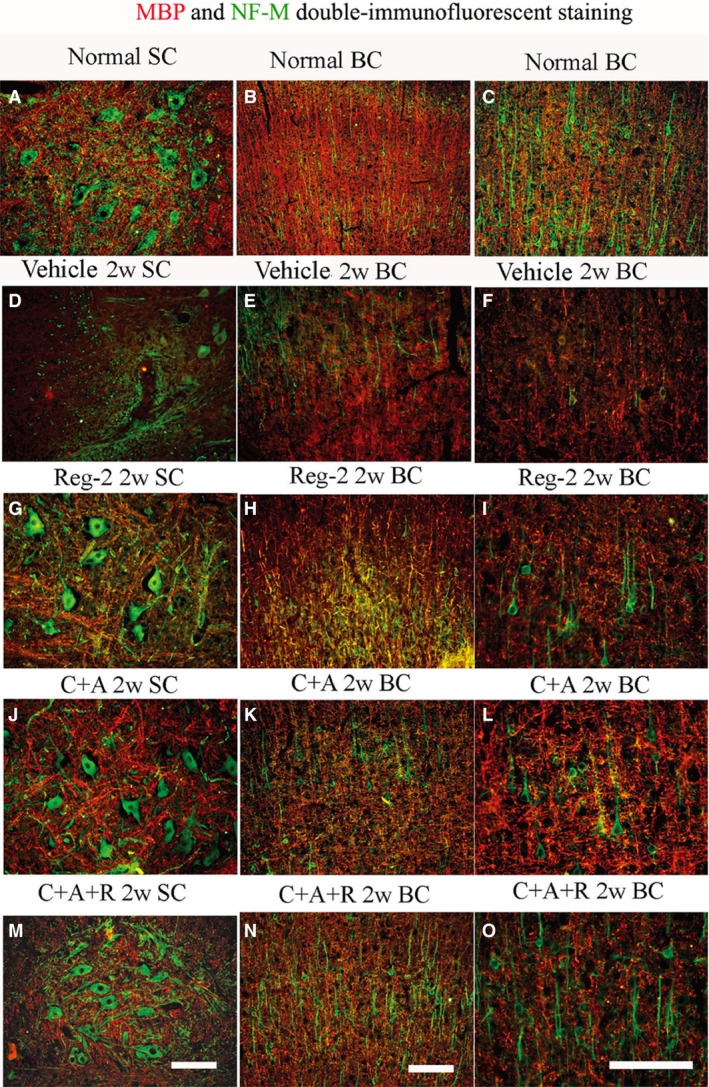
At 2 weeks Pi, the vehicle group revealed visible demyelination (showed by MBP immunofluorescence, red) phenomenon accompanied with the loss of neurofilaments (showed by NF‐M immunofluorescence, green). However, C16, Ang1 and Reg‐2 treatments could reduce demyelination and axonal loss in the CNS following EAE induction, and C+A+R application produced more pronounced effects. Scale bar: 100 μm. SC, transverse sections through the anterior horn of the lumbar spinal; BC, coronal sections of the motor cortex.
Two weeks Pi, impregnation of axons with Bielschowsky's silver stain and NF‐M, a marker of neurofilaments, immunohistochemical labeling revealed a reduction in axonal density, and an increase of sparse neurofilaments and fragmentation in the cortex and spinal cord of vehicle‐treated EAE rats (Figs 3D–F and 4A,B) in comparison with the normal healthy animals (Figs 3A–C and 4Q–S). Injured axons displayed swelling, deformation and ovoid formations (Fig. 4B). Greater numbers of axons with relatively normal morphology were observed in Reg‐2, C+A and C+A+R treatments groups vs. the vehicle‐treated controls (Figs 3G–O and 4E,F,I,J,M,N). At 8 weeks Pi, vehicle‐treated EAE rats displayed less axonal density than normal controls in both the spinal cord and cortex (Fig. 4C,D), and some neurons presented a dissolving necrotic appearance with only a few remaining neurofilaments (Fig. 4T). By contrast, greater numbers of axons with relatively normal morphology were observed in C+A‐ and Reg‐2‐treated EAE rats (Fig. 4G,H,K,L), most notably in the C+A+R group (Fig. 4O,P). Scoring of axonal loss at 2 and 8 weeks Pi (Fig. 4U,V) also confirmed the superior effects of Reg‐2 and C+A treatment on axonal protection, and C+A+R therapy was significantly the most effective treatment (P < 0.05).
Figure 4.
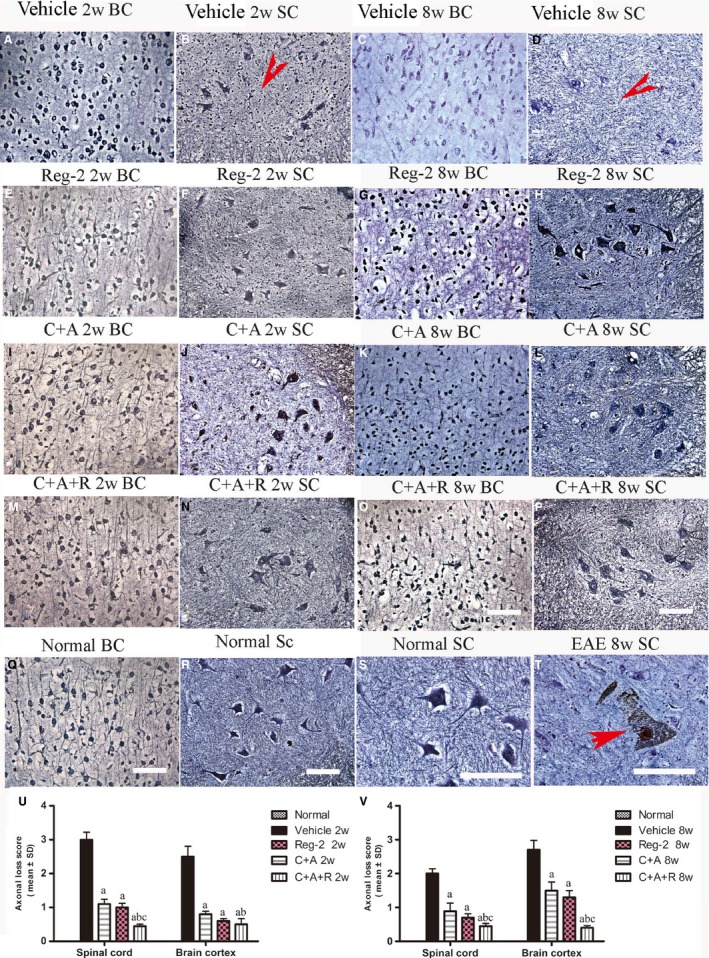
C16+Ang1, Reg‐2, and C+A+R treatments alleviated axonal loss revealed by Bielschowsky staining at both 2 and 8 weeks Pi. Scale bar: 100 µm. SC, transverse sections through the anterior horn of the lumbar spinal; BC, coronal sections of the motor cortex. (B,D) In vehicle‐treated EAE rats, numerous axons undergo gradual loss and exhibited deformed and ovoid formation (arrows) and, at 8 weeks Pi, neurons in the anterior horn of the spinal cord presented a dissolving necrotic appearance with only a few remaining neurofilaments (arrow in T), while C16+Ang1 and Reg‐2 treatments preserved more axons in the CNS following EAE induction. The triple treatment group C+A+R application showed the most obvious effects at both (U) 2 and (V) 8 weeks Pi, showed by estimated axonal loss score. (a) P < 0.05 vs. vehicle‐treated EAE rats; (b) P < 0.05 vs. Reg‐2‐treated EAE rats; (c) P < 0.05 vs. C+A‐treated EAE rats.
Transmission electron microscopy showed the absence of edema around blood vessels of normal control rats (Fig. 5B); myelin, axon and cell nuclei all exhibited normal signs (Fig. 5A–C). However, in vehicle‐treated EAE rats, severe edema (Fig. 5E) was detected in the extracellular space surrounding blood vessels, myelin displayed splitting and vacuolar changes (red arrow in Fig. 5D), and neurons showed signs of necrosis (Fig. 5F) and apoptosis (Fig. 5G) at 2 weeks Pi. In contrast, in C+A‐ and C+A+R‐treated EAE rats, we observed reduced localized edema (Fig. 5I,M) and lighter vacuolated myelin sheaths (Fig. 5H,L). In Reg‐2‐treated rats, a certain degree of vesicular disintegration and edema were still visible (Fig. 5K); however, myelin displayed a relatively normal morphology (Fig. 5J). At week 8 Pi, notable demyelination was evident in the vehicle‐treated group (Fig. 5N,O); however, myelinated and remyelinated fibers were more intact in the C+A‐ and Reg‐2‐treated groups (Fig. 5P–S). C+A+R‐treated EAE rats exhibited a larger number of intact myelinated fibers and thinly re‐myelinated axons (Fig. 5T–U). Furthermore, neighboring nuclei showed a normal ultrastructure (Fig. 5V). Quantification of thinly re‐myelinated axons revealed that at 8 weeks Pi, thinly myelinated axons were evidently increased in C+A‐, Reg‐2‐ and especially in the C+A+R‐treated groups, when compared with the vehicle group (P < 0.05; Fig. 5W). The re‐myelinated thin axons were distinguished from the existing thinly damaged myelinated axons depending on the axonal morphology.
Figure 5.
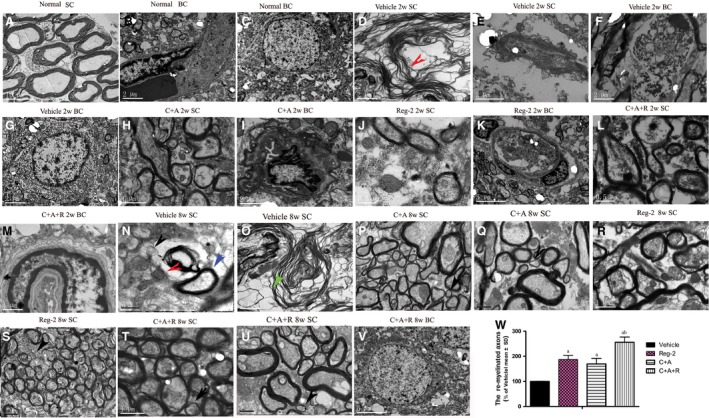
Electron micrograph demonstrating the prevention of perivascular edema, demyelination/axon loss, and neuronal apoptosis in C16+Ang1‐, Reg‐2‐ and C+A+R‐treated groups. (A–C) Normal control rats (A) normal myelinated axons exhibiting dark, ring‐shaped myelin sheaths surrounding axons; (B) blood vessel with normal shape, arrow indicates an endothelial cell; (C) normal neuronal nuclei with uncondensed chromatin; (D–G) vehicle‐treated EAE rats 2 weeks Pi. (D) Myelin sheath displaying splitting, vacuoles, loose and fused changes, and shrunken, atrophied axons (red arrow). (E) Severe blood vessel leakage and tissue edema was detected in the extracellular space surrounding the vessels. (F) A necrotic neuron with large vacuoles and degenerated organelles in the perikaryon, rupturing cytoplasmic membrane and oncolytic chromatin. (G) Neuron showing apoptotic signs with a shrunken nucleus and condensed, fragmented and marginated nuclear chromatin. In the meantime, in C+A‐ (H,I), Reg‐2‐ (J,K), and C+A+R‐ (L,M)treated groups, myelin sheath splitting, axonal loss and perivascular edema were reduced. At week 8 Pi, many myelin lamellae were still undergoing vesicular disintegration and demyelination (N,O). The unmyelinated axons showed swollen axon profiles and contained vesicles (black arrows in N), tubulo‐vesicular structures and small mitochondria (red arrows in N), some fibers were completely lost and a disintegrated empty circle of myelin was left (green arrow in O). On the contrary, in C+A (P,Q), Reg‐2 (R,S) and C+A+R (T,U), the newly formed myelin sheaths surrounding intact axons (red arrows P–U), the morphology nucleus were relatively normal, especially in the C+A+R‐treated group (V). (W) Quantification of thinly re‐myelinated axons revealed that the thinly myelinated axons were increased in all treatment groups vs. the vehicle group (P < 0.05). (A) Scale bar: 10 μm; (K,V) scale bar: 5 μm; (B–G, I,O) scale bar: 2 μm; (H, P, R, S, M,T, U) scale bar: 1 μm; (J, L, N, Q) scale bar: 0.5 μm. SC, transverse sections through the anterior horn of the lumbar spinal; BC, coronal sections of the motor cortex.
Generally speaking, the thinly re‐myelinated axons had only two–three layers of newly formed myelin surrounding the axons and they kept a relatively normal ultrastructure, but the existing undamaged myelinated axons often coated by more layers of myelin than the thinly re‐myelinated axons (blue arrows in Fig. 5N), and these axons also kept relatively normal ultrastructural structure. Examination of the axonal ultrastructure revealed that in the case of demyelination, the form of unmyelinated axons showed swollen axonal profiles, which contained vesicles (black arrows in Fig. 5N), tubulo‐vesicular structures, or shrunken axons and small mitochondria (red arrows in Fig. 5N), some fibers were completely lost and only a disintegrated empty circle of myelin was left (green arrow in Fig. 5O). Due to the disintegrated structure and enhanced inter‐myelin space, the thickness of damaged myelin might not show obvious differences when compared with thinly re‐formed myelin, which surrounded intact axons (red arrows in Fig. 5P–U). The G‐ratio of axon diameter against the myelinated axons was also larger than in the vehicle‐treated group (Table 7).
Table 7.
The G‐ratio (axon diameter/diameter of myelinated axons) at 8 weeks Pi among the different groups
| Groups | Mean diameter of axons (μm) | Mean diameter of myelinated axons | Mean G‐ratio |
|---|---|---|---|
| Normal control | 0.85 ± 0.27b | 0.99 ± 0.17a | 0.86 ± 0.19a |
| Vehicle‐treated | 0.67 ± 0.13 | 0.81 ± 0.22 | 0.81 ± 0.12 |
| Reg‐2 treated | 0.76 ± 0.11a | 0.89 ± 0.15a | 0.85 ± 0.12a |
| C+A treated | 0.80 ± 0.23a | 0.90 ± 0.17a | 0.86 ± 0.24a |
| C+A+R treated | 0.82 ± 0.19a | 0.94 ± 0.15a | 0.86 ± 0.18a |
P < 0.05 vs. vehicle‐treated EAE rats.
P < 0.01 vs. vehicle‐treated EAE rats.
Moreover, the oligodendrocyte progenitor cells (OPCs) proliferation marker olig1 immunostaining revealed that Reg‐2 and C+A+R treatments significantly enhanced the expression of olig1, compared with vehicle‐ and C+A‐treated groups (P < 0.05; Fig. 6A–I). These results confirm that Reg‐2 can promote OPC proliferation similar to the effects of CNTF (Albrecht et al. 2007).
Figure 6.
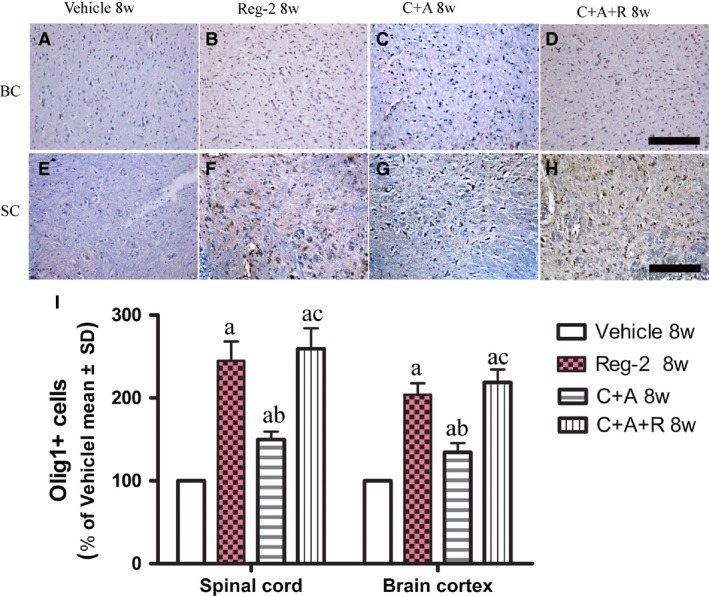
At 8 weeks Pi, Reg‐2 and C+A+R treatments enhanced oligodendrocyte progenitor cells (OPCs) proliferation, as demonstrated by Olig1 immunostaining (A–H, counterstained with hematoxylin). Scale bar: 100 μm. SC, transverse sections through the anterior horn of the lumbar spinal; BC, coronal sections of the motor cortex. (a) P < 0.05 vs. vehicle‐treated EAE rats; (b) P < 0.05 vs. Reg‐2‐treated EAE rats; (c) P < 0.05 vs. C+A‐treated EAE rats.
C16, Ang1 and Reg‐2 treatments suppress the expression of proinflammatory factors COX‐2, NF‐κB, TNF‐α and IFN‐γ, but increase the expression of anti‐inflammatory cytokines TGF‐β and growth‐associated protein GAP‐43
At 2 and 8 weeks Pi, the expression levels of COX‐2, NF‐kB, TNF‐α and GAP‐43 were detected by immunostaining and Western blotting in the brains and spinal cords of EAE‐treated groups (Figs 7andS3). TGF‐β and IFN‐γ levels were measured by ELISA (Fig. 8A–D) in the serum at the early (week 2) and late (week 8) stages of acute EAE. The expressions of important transcription factors in inflammatory pathways, such as COX‐2 and NF‐κB, and inflammatory cytokines, such as TNF‐α and IFN‐γ, were significantly increased in vehicle‐treated EAE rats, while the C+A, Reg‐2 and C+A+R treatments markedly reduced the expression of those factors (Figs 7A–N, 8C,D and S3).
Figure 7.
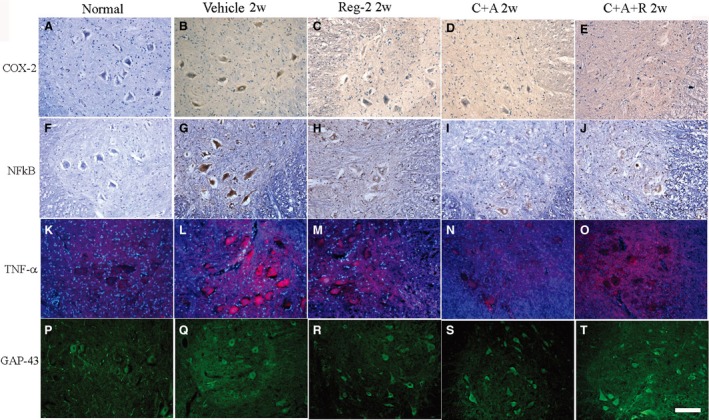
At 2 weeks Pi, pre‐inflammatory factors COX‐2 (A–E, immunostaining, counterstained with hematoxylin), NFκB (F–J, immunostaining, counterstained with hematoxylin), TNF‐α (K–O, red color immunofluorescence staining, nuclei of all cells were stained with blue color of Hoechst 33342) and GAP‐43 (P–T, green color immunofluorescence staining) exhibited visible expression levels in the lumbar spinal cord anterior horn. Scale bar: 100 μm. COX‐2, NF‐κB and TNF‐α were all significantly increased in vehicle‐treated EAE rats, while the C+A, Reg‐2 and C+A+R treatments could markedly reduce the expression of those factors. Moreover, treatment with C+A, Reg‐2 and C+A+R upregulated the expression of GAP‐43.
Figure 8.
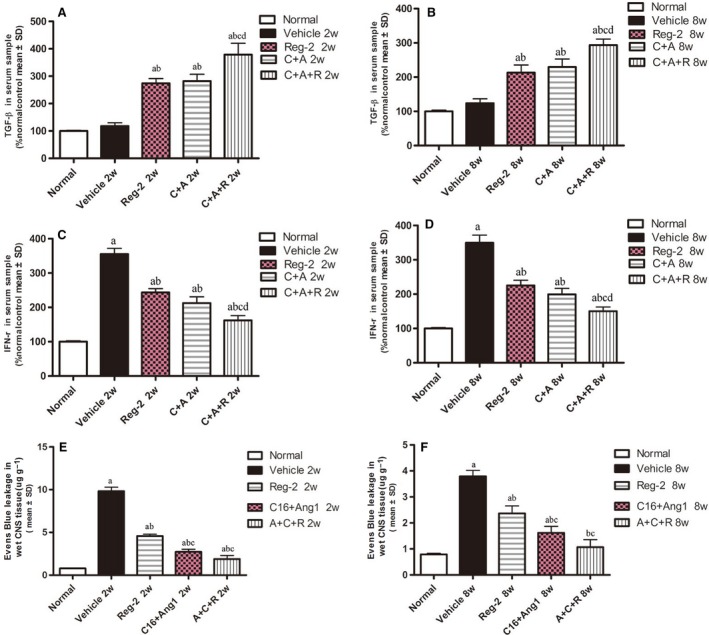
(A–D) Ang‐1+C16, Reg‐2 and most notably C+A+R treatments effectively reduced the expression of the proinflammatory cytokines IFN‐γ, which were upregulated in vehicle‐treated EAE rats (A,B). However, the anti‐inflammatory cytokines TGF‐β (C,D) increased with CNTF and Reg‐2 treatments. Quantification of the proinflammatory cytokine IFN‐γ and anti‐inflammatory cytokines TGF‐β in serum samples at weeks 2 (A,C) and 8 (B,D) Pi by ELISA. (E–F) Evans blue extravasation was significantly higher in vehicle‐treated EAE rats, but was reduced in C16+Ang1 and Reg‐2, especially the C+A+R application at 2 (E) and 8 (F) weeks Pi. (a) P < 0.05 vs. normal control; (b) P < 0.05 vs. vehicle‐treated EAE rats; (c) P < 0.05 vs. Reg‐2‐treated EAE rats; (d) P < 0.05 vs. C+A‐treated EAE rats.
EAE‐induction slightly increased the expression of GAP‐43 in the early stages of the disease (2 weeks Pi), but expression decreased as EAE progressed (Figs 7P and S3D). However, the treatment of C+A, Reg‐2 and C+A+R could markedly upregulate the expression of GAP‐43 (Figs 7Q–S and S3D). Moreover, although the expression levels of the anti‐inflammatory cytokine TGF‐β were not significantly different between the vehicle‐treated EAE rats and control rats at 2 and 8 weeks Pi, treatment with C+A or Reg‐2 increased TGF‐β expression. Furthermore, the combination treatment of C+A+R produced the highest increase in TGF‐β expression (Fig. 8A,B).
C+A, Reg‐2 and C+A+R treatments reduce blood vessel leakage and BBB permeability, and C+A/C+A+R treatments produce more pronounced effects
At the early stage of EAE, Evans blue content in vehicle‐treated rats was 10‐fold higher than in normal healthy rats in (Fig. 8E). C+A and C+A+R+C treatments significantly reduced the amount of Evans blue extravasation; however, Reg‐2‐treated rats still exhibited fivefold higher Evans blue extravasation than normal control rats (Fig. 8E). At 8 weeks Pi, Evans blue extravasation content in the vehicle group was fourfold higher than the controls. Reg‐2‐treated rats exhibited higher Evans blue extravasation (2.5‐fold), while the C+A group was1.5‐fold and C+A+R group was 0.5‐fold higher than normal control (Fig. 8F).
C16, Ang1 and Reg‐2 treatments alleviated reactive astrocyte proliferation and reactive gliosis in EAE rats
To assess the effects of C+A, Reg‐2 and C+A+R treatments on EAE‐induced reactive gliosis, we examined the expression of GFAP, a marker for astrocytes, by immunofluorescence labeling in the spinal cord and the cerebral cortex. At 8 weeks Pi, immunolabeling showed that astrocytes proliferated and formed a visible glial scar (Fig. 9C,D) in vehicle‐treated EAE rats compared with control rats (Fig. 9A,B). Conversely, GFAP expression and astrocyte proliferation were significantly reduced in both C+A‐ and Reg‐2‐treated groups (Fig. 9E–H), and combination treatment with C+A+R resulted in higher suppression of glial scar formation in both the lumbar spinal cord and brain cortex (Fig. 9I,J).
Figure 9.
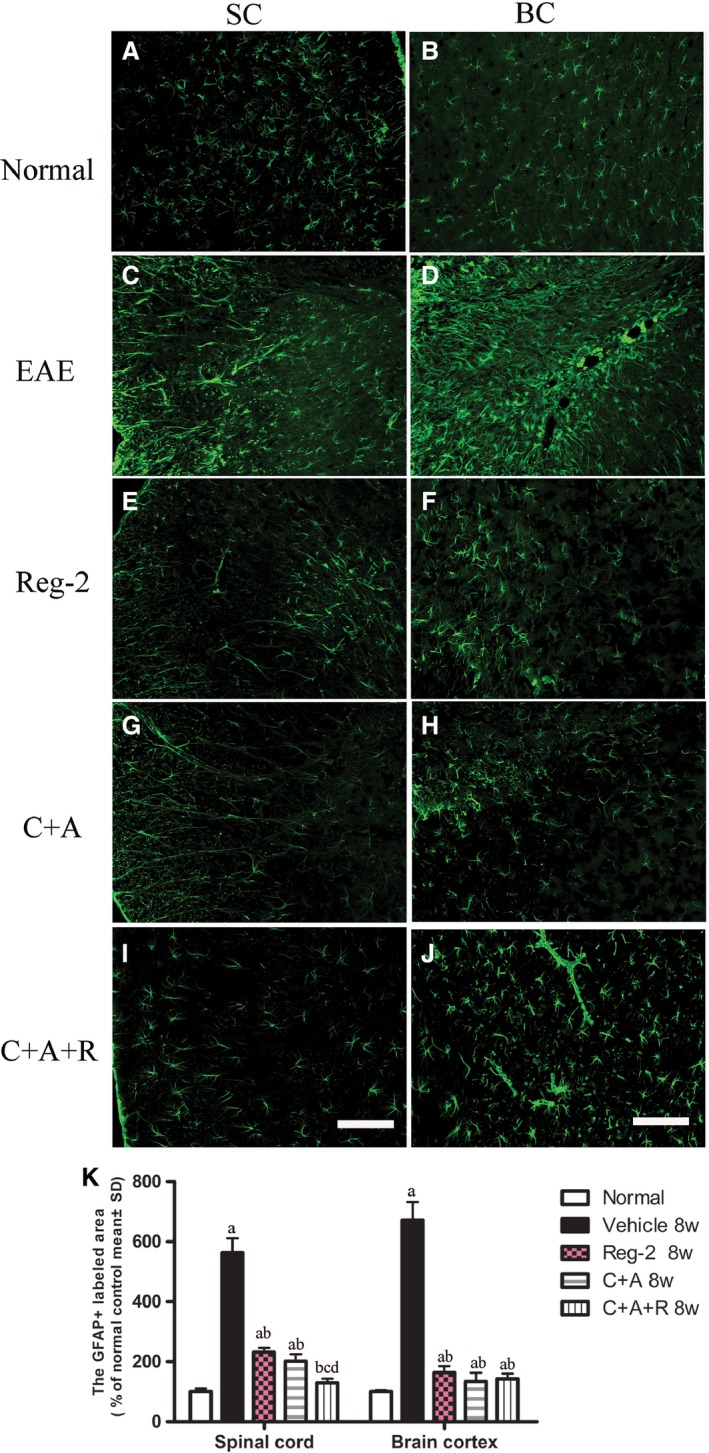
C+A, Reg‐2 and C+A+R treatments inhibit reactive gliosis in EAE rats at 8 weeks Pi. Green immunofluorescence indicates GFAP staining, Scale bar: 100 μm. (a) P < 0.05 vs. normal control; (b) P < 0.05 vs. vehicle‐treated EAE rats; (c) P < 0.05 vs. Reg‐2‐treated EAE rats; (d) P < 0.05 vs. C+A‐treated EAE rats. SC, transverse sections through the anterior horn of the lumbar spinal; BC, coronal sections of the motor cortex.
C+A, Reg‐2 and C+A+ R treatments reduce apoptotic neuronal loss in the CNS of EAE rats
Immunostaining for active caspase‐3 (Fig. 10), an enzyme involved in the execution of apoptosis, showed the upregulation of caspase‐3 expression in large multipolar motor neurons in the spinal cord anterior horn and the pyramid‐shaped motoneurons of the precentral gyrus in vehicle‐treated EAE rats compared with rats in the normal group (Fig. 10A–D). This phenomenon was visibly reversed by C+A (Fig. 10I–L), Reg‐2 (Fig. 10E–H) and C+A+R (Fig. 10M–P) treatments at both 2 weeks (Fig. 10S) and 8 weeks (Fig. 10T), particularly in the C+A+R‐treated group. Visible neuronal loss (Fig. 11) was also observed in the CNS of the vehicle‐treated EAE rats at 8 weeks Pi (Fig. 11K) when compared with normal rats. Nevertheless, in C+A‐ (Fig. 11G,H), Reg‐2‐ (Fig. 11E,F) and C+A+R‐treated EAE rats (Fig. 11I,J), a higher number of neurons was present in the anterior horn of the spinal cord and in the motor cortices. There was no significant difference between C+A‐ and Reg‐2‐treated groups; however, in the C+A+R‐treated group the number of neurons was significantly higher than the other two groups (Fig. 11K; P < 0.05).
Figure 10.
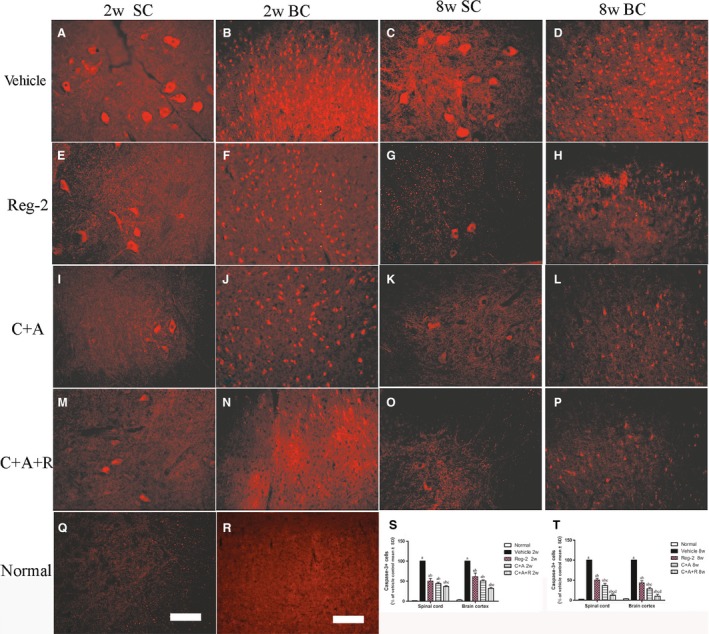
In vehicle‐treated EAE rats, the expression of active caspase‐3 was markedly increased. This phenomenon could be reversed by C+A, Reg‐2 and C+A+R treatments, more evidently at 8 weeks post‐immunization, as shown by calculated red color immunofluorescence‐stained caspase‐3‐positive cells (scale bar: 100 µm). (a) P < 0.05 vs. normal control; (b) P < 0.05 vs. vehicle‐treated EAE rats; (c) P < 0.05 vs. Reg‐2‐treated EAE rats; (d) P < 0.05 vs. C+A‐treated EAE rats. SC, transverse sections through the anterior horn of the lumbar spinal; BC, coronal sections of the motor cortex.
Figure 11.
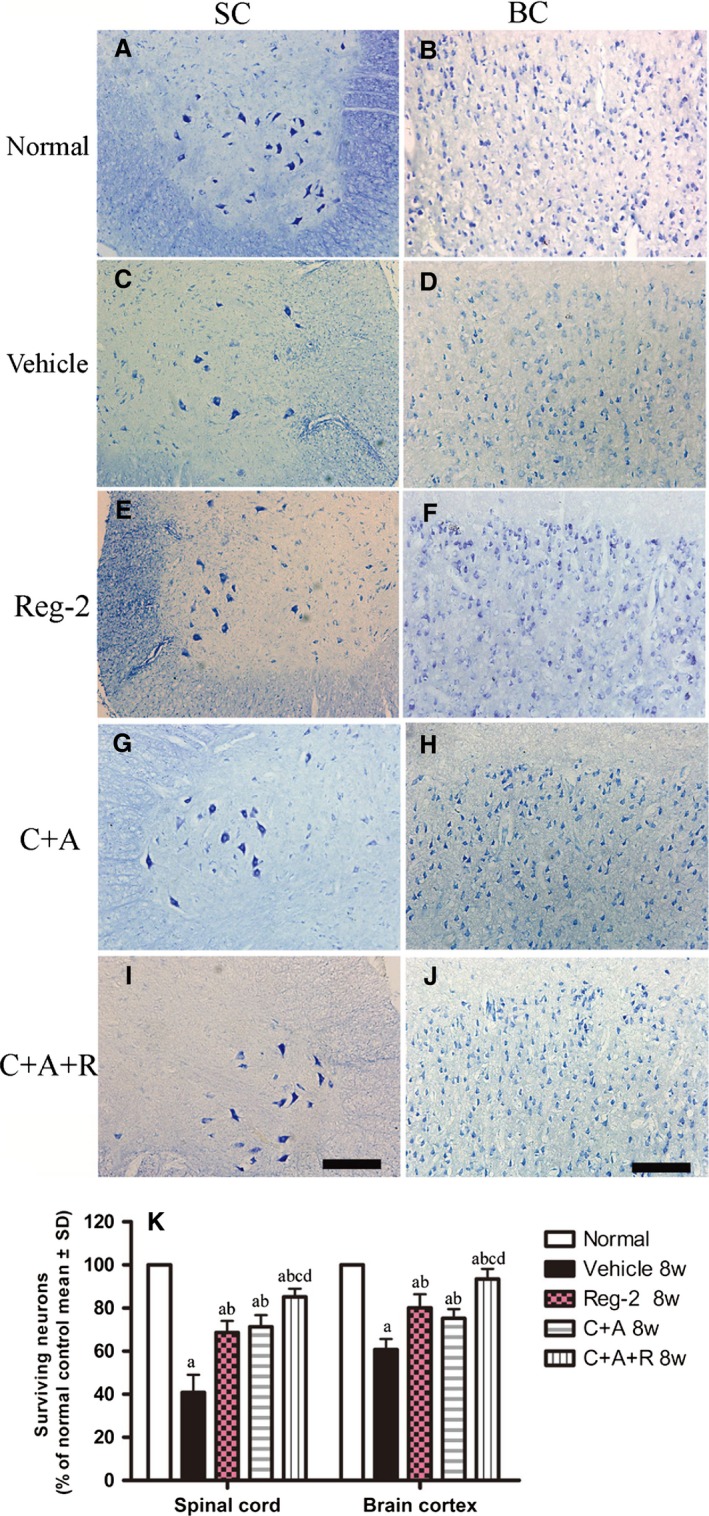
(A–J) Treatment with C+A, Reg‐2 and C+A+R reduced neuronal loss in the spinal cord and brain as verified by Nissl staining at 8 weeks Pi; scale bar: 100 μm. SC, transverse sections through the anterior horn of the lumbar spinal; BC, coronal sections of the motor cortex. (K) Surviving neural cells calculated in different groups at 8 weeks Pi following Nissl staining (each group is presented as a percentage of the normal control). (a) P < 0.05 vs. normal control; (b) P < 0.05 vs. vehicle‐treated EAE rats.
Discussion
Multiple sclerosis is characterized by inflammation, demyelination and axonal pathology (Li et al. 2015). In the pathogenesis of both MS and the MS animal model EAE, demyelination is regarded as a major pathological factor in the development of clinical symptoms. Therefore, using agents that promote remyelination in MS treatment is a plausible rationale for treating patients (Ma et al. 2010).
Ciliary neurotrophic factor is a 25‐kD nerve growth factor that is highly expressed in the optic nerves, olfactory bulbs and the spinal cord (Webster, 1997). Previous studies have shown that increasing levels of CNTF mRNA and peptide are correlated with the proliferation and differentiation of myelin‐associated Schwann cells (Webster, 1997; Kuhlmann et al. 2006). CNTF also prevents death of oligodendrocytes under proinflammatory conditions of CNS (Linker et al. 2002). It is therefore most likely that CNTF enhances the proliferation of oligodendrocyte precursor cells, which aids in remyelination and repair (Webster, 1997; Linker et al. 2002; Stankoff et al. 2002; Kuhlmann et al. 2006). Moreover, CNTF promotes neuronal differentiation and survival during both development and following injury, as well as protecting cultured human oligodendrocytes from TNF‐mediated injury (Stankoff et al. 2002; Fang et al. 2013a). Despite the protective function of CNTF in demyelinating CNS diseases and neuroinflammation, therapeutic use of CNTF is limited, owing to the large molecular weight of CNTF, thereby preventing passage through the BBB (Kuhlmann et al. 2006).
Reg‐2 is a secreted protein of a relatively smaller molecular weight, 16 kD. Reg‐2 belongs to a family of homologous proteins found in the pancreas and gastrointestinal tract under both normal and pathological conditions (Linker et al. 2002). Previous studies revealed that Reg‐2 expression is a necessary step in the CNTF survival pathway; more specifically, it functions as a motoneuron neurotrophic factor and a signaling intermediate in the CNTF survival pathway (Nishimune et al. 2000). In an animal model of spinal cord injury, our group previously demonstrated the potential neuroprotective effects of Reg‐2 through increasing axonal growth and inhibiting neuronal apoptosis both in vivo and in vitro (Fang et al. 2010, 2011a,b). Furthermore, in a rodent EAE model, we observed that both Reg‐2 and CNTF treatments resulted in reduced axonal loss and demyelination, neuronal survival, and functional improvement (data not shown). Moreover, long‐term Reg‐2 injection in rats did not result in adverse effects as those seen with long‐term CNTF treatments, such as no visible fever, hair loss, disheveled appearance or weight loss were observed (data not shown). Given the smaller molecular weight of Reg‐2, and therefore the ease by which it crosses the BBB, we proposed that Reg‐2 could be used as a substitute for CNTF in therapy for EAE and MS. Indeed, results shown in our study proved its efficacy in EAE treatment.
In MS, inflammation of the CNS is induced by autoimmunity, persistence of inflammatory stimuli and/or failure to resolve the acute inflammatory response leading to chronic inflammation in CNS (Lecuyer et al. 2016). Disruption of the BBB appears to be a critical event in the disease process of MS and EAE (Jiang et al. 2014; Lecuyer et al. 2016; Wang et al. 2015). Enhanced permeability of the BBB facilitates edema formation and recruitment of inflammatory cells into target tissues to mediate eventual myelin loss and neuronal dysfunction (Lecuyer et al. 2016). Previously, we reported that Ang‐1 treatment could ameliorate inflammation‐induced leakage, inhibit inflammatory cell infiltration into the brain and spinal cord, and improve functional impairment associated with EAE in a dose‐dependent manner (Jiang et al. 2014). In spite of partly overlapping mechanisms of Ang1 and C16 (a peptide that interferes with leukocyte ligand binding required for transmigration and plays a dynamic role in preventing leukocyte entrance into the CNS), the combination of treatments of Ang‐1 and C16 could synergistically improve anti‐inflammatory responses (Wang et al. 2015). Results obtained previously suggested that Ang‐1 and C16 target specific receptors to act through different pathways (Wang et al. 2015). Indeed, in the current study, we observed that C+A treatment could evidently improve the functional recovery more than the vehicle‐treated group.
In the present study, we observed diffuse infiltration of inflammatory cells in the CNS of vehicle‐treated rats throughout the brain and spinal cord parenchyma. Reg‐2 treatment decreased severe perivascular and parenchymal inflammatory cell infiltration to a certain degree, while C+A treatment further reduced the inflammation score. This phenomenon suggested that as a downstream signaling protein in the CNTF survival pathway, Reg‐2 may also function as a modulator in neuroinflammation. However, the main effect in the CNS is as a motor neuron neurotrophic factor (Nishimune et al. 2000). On the other hand, C+A treatment mainly functioned to promote endothelial cells survival, reduce blood vessel leakage and competitively decrease monocytes transendothelial migration, thus showing more clear effects in alleviating neuroinflammatory conditions in the CNS. Due to the different pathways they targeted, the combined application of both (C+A+R) obtained more prominent effects.
Consequently, we examined the effect of Reg‐2 or C+A on proinflammatory cytokines. We observed that they could significantly downregulate the expression of the proinflammatory cytokines TNF‐α and IFN‐γ, and transcription factors COX‐2 and NF‐kB in inflammatory pathways, but increased the expression of the anti‐inflammatory cytokines TGF‐β. Similarly, treatment with C+A+R resulted in maximal synergistic effect and hence produced the most pronounced results among the other treatment groups.
In the C+A group, the relief of perivascular cellular inflammation and CNS edema and the improvement of the local microenvironment lead to inhibition of the release of inflammatory factors that may activate immune cells and initiate the disruption of the BBB. This therefore terminated the negative cycle of further BBB damage. However, Reg‐2 possibly suppresses CD4+ T helper1 (Th1) lymphocytes and may have supportive effects on the anti‐inflammatory cytokines produced by CD4+ Th2 cells (Fang et al. 2013a,b). Moreover, our research also showed that Reg‐2 treatment decreased high Evans blue extravasation by 50% compared with the vehicle group, while the C+A and C+A+R groups relieved the Evans blue extravasation to much lower levels than the Reg‐2 group, suggesting that their underlying mechanisms are at least partly different.
An improved macro‐environment is beneficial in preserving the myelin integrity, and could further protect the surrounding axons in the CNS disease (Lecuyer et al. 2016). In this study, we observed that the Reg‐2 treatment and the combination treatments decreased demyelination and axonal loss compared with the vehicle‐treated group. It has been reported that the proinflammatory cytokines and transcription factors TNF‐α, COX‐2, IFN‐r and NF‐κB act as tissue‐damaging agents through regulating the expression of genes related to cytokines, and consequently leading to oligodendrocyte and neuron apoptosis in the EAE model (Arellano et al. 2015; Wang et al. 2015). The reduction of the demyelination area and neuronal loss in each treatment group was accompanied by a decrease in expression of proinflammatory factors, and an increase of GAP‐43, a protein considered crucial for axon regeneration (Sachdeva et al. 2016). Upregulation of GAP‐43 expression prevented neural cell death and promoted axonal regeneration, which was consistent with the increase in thinly re‐myelinated axons in all drug‐treated groups. Moreover, Reg‐2 and C+A+R treatments could significantly enhance the proliferation of OPCs as demonstrated by the OPC marker olig1 immunostaining (P < 0.05) These findings confirmed that Reg‐2 exerts neuroprotective effects similar to that of CNTF (Nishimune et al. 2000). The protective effects on oligodendrocytes and inhibition of reactive astrocyte proliferation/reactive gliosis, promoted via NF‐κB activation (Gabel et al. 2015), achieved functional recovery of EAE clinical symptoms in all treated groups.
Based on the results of multiple histological, behavioral, molecular biological, electrophysiological and iconographic assays, it is plausible to assume that Reg‐2 administration may rescue oligodendrocytes and neuronal axons mainly by direct neurotrophic effects, while C16+Ang‐1 mainly improve the inflammatory milieu. Therefore, triple treatment was the most successful in preventing demyelination and axonal loss while enhancing remyelination.
It is worth mentioning that in this study we choose to administer various treatments immediately after EAE induction based on results from our previous studies indicating the superior effect of early treatment protocol vs. delayed treatment at the onset of the clinical symptoms. Over the first 14 days post‐spinal cord injury, we administered 100 mg C16 either immediately or at 4 h post injury. The 4‐h time point was chosen because this is the timeframe in which most human spinal cord injury cases are diagnosed and intravenous treatments are administered. Functional tests showed that delayed C16 treatment provided substantial functional improvement compared with the vehicle‐treated group. However, the delayed C16‐treated group showed lower effectiveness when compared with the group in which C16 treatment was given immediately post‐injury (Han et al. 2010).
In another study, we studied the effect of delayed C16 administration in rodent acute EAE model. Daily injections of C16 were started 10 days post‐immunization (when the clinical symptoms of motor disability appeared), and animals were assessed at 2 weeks or at 8 weeks post‐immunization. At 2 weeks post‐immunization, C16 injection was administered for 4 days, the clinical score was not improved. However, the infiltration of inflammatory cells was partly reduced and the proinflammatory cytokines/apoptotic signals were also suppressed. Interestingly, the disease severity was clearly alleviated and a more rapid recovery in locomotor function was detected at week 8 post‐immunization, after receiving C16 treatment for a 2‐week duration. These results implied that delayed C16 treatment could also, at least to a certain extent, offer neuroprotective effects for EAE. However, its effects were not as evident or as beneficial as the immediate treatment (Han et al. 2013). Based on the abovementioned results, we came to the conclusion that early treatment applied at the time of EAE induction is more effective than delayed treatment (started at the time of clinical symptoms).
In conclusion, in this study we demonstrated that combining C16, Reg‐2 and Ang‐1 produced synergistic effects that resulted in a better clinical outcome in the EAE model. Therefore, using molecules that target these molecular signaling pathways may be beneficial for exploring new potential therapeutic agents for MS treatment.
Author contributions
SH designed the experiments and drafted the manuscript; HJ participated in the study design and coordination; KW‐T and FZ performed the experiments; BBW analyzed the data and revised the manuscript. All authors read and approved the final manuscript.
Conflict of interest
The authors declare no conflict of interest.
Supporting information
Fig. S1. (A–C) Combination treatment of C16, Ang1 and Reg‐2 reduced the clinical severity of EAE in rats at (A) 1, (B) 2 and (C) 8 weeks Pi, as measured by determining somatosensory‐evoked potential (c‐SEP) latencies and amplitudes [measured from peak to peak between negative deflection (N) and positive deflection (P)]. The amplitude of c‐SEP was notably lower in vehicle‐treated EAE rats and the latency was also significantly prolonged, while treatments with C+A, Reg‐2, especially the C+A+R group, effectively reversed these phenomena. (D–F) Motor‐evoked potential (MEP) amplitude was also significantly lower in vehicle‐treated EAE rats, and the latency was also significantly prolonged. Similarly, these phenomena were reversed following C+A and Reg‐2 and, especially, the C+A+R treatment groups.
Fig. S2. (A–F) Combination of C16, Ang1 and Reg‐2 treatments inhibited demyelination in the CNS, as showed by LFB staining. Scale bar: 100 μm. At 2 weeks Pi, massive confluent demyelinated areas were present in the parenchyma in CNS of vehicle‐treated EAE rats accompanied with the significant inflammatory cells infiltration (B,C), while at the same time point, when treated with C16+Ang1, Reg‐2 and C+A+R, visible areas of myelination were evidently preserved. (G,H) Demyelination was determined by scoring demyelination. C16+Ang1‐, Reg‐2‐ and C+A+R ‐treated rats exhibited notably less demyelination at both (A) 2 and (B) 8 weeks Pi. (A) P < 0.05 vs. vehicle‐treated EAE rats; (B) P < 0.05 vs. Reg‐2‐treated EAE rats; (C) P < 0.05 vs. C+A‐treated EAE rats.
Fig. S3. NF‐кB, COX‐2, TNF‐α and GAP‐43 expression levels increased post‐immunization, as detected by Western blotting in the brain cortex and lumbar spinal cord, while the treatments of Ang‐1+C16, Reg‐2 and C+A+R reversed the upregulation of NF‐кB, COX‐2 and TNF‐α, and further increased the expression of GAP‐43. (A) P < 0.05 vs. normal control; (B) P < 0.05 vs. vehicle‐treated EAE rats; (C) P < 0.05 vs. Reg‐2‐treated EAE rats; (D) P < 0.05 vs. C+A‐treated EAE rats.
Acknowledgements
This work was funded by the Zhejiang Provincial Natural Science Foundation of China no. LY16H09002, R2110025 and the National Natural Science Foundation of China, project no. 81271333. Also, the authors would like to thank Medjaden Bioscience Ltd (http://www.medjaden.com/index.html) for providing English language editing services.
Ke‐Wei Tian and Fan Zhang are equally contributing co‐authors in this article.
References
- Albrecht PJ, Enterline JC, Cromer J, et al. (2007) CNTF‐activated astrocytes release a soluble trophic activity for oligodendrocyte progenitors. Neurochem Res 32, 263–271. [DOI] [PubMed] [Google Scholar]
- All AH, Walczak P, Agrawal G, et al. (2009) Effect of MOG sensitization on somatosensory evoked potential in Lewis rats. J Neurol Sci 284, 81–89. [DOI] [PMC free article] [PubMed] [Google Scholar]
- Amadio S, Pluchino S, Brini E, et al. (2006) Motor evoked potentials in a mouse model of chronic multiple sclerosis. Muscle Nerve 33, 265–273. [DOI] [PubMed] [Google Scholar]
- Arellano G, Ottum PA, Reyes LI, et al. (2015) Stage‐specific role of interferon‐gamma in experimental autoimmune encephalomyelitis and multiple sclerosis. Front Immunol 6, 492. [DOI] [PMC free article] [PubMed] [Google Scholar]
- Baker D, Amor S (2014) Experimental autoimmune encephalomyelitis is a good model of multiple sclerosis if used wisely. Mult Scler Relat Disord 3, 555–564. [DOI] [PubMed] [Google Scholar]
- Bolay H, Gursoy‐Ozdemir Y, Unal I, et al. (2000) Altered mechanisms of motor‐evoked potential generation after transient focal cerebral ischemia in the rat: implications for transcranial magnetic stimulation. Brain Res 873, 26–33. [DOI] [PubMed] [Google Scholar]
- Devaux J, Forni C, Beeton C, et al. (2003) Myelin basic protein‐reactive T cells induce conduction failure in vivo but not in vitro . NeuroReport 14, 317–320. [DOI] [PubMed] [Google Scholar]
- Fang M, Huang JY, Ling SC, et al. (2010) Effects of Reg‐2 on survival of spinal cord neurons in vitro . Anat Rec (Hoboken) 293, 464–476. [DOI] [PubMed] [Google Scholar]
- Fang M, Huang JY, Wang J, et al. (2011a) Anti‐neuroinflammatory and neurotrophic effects of combined therapy with annexin II and Reg‐2 on injured spinal cord. Neurosignals 19, 16–43. [DOI] [PubMed] [Google Scholar]
- Fang M, Wang J, Huang JY, et al. (2011b) The neuroprotective effects of Reg‐2 following spinal cord transection injury. Anat Rec (Hoboken) 294, 24–45. [DOI] [PubMed] [Google Scholar]
- Fang M, He D, Zhang F, et al. (2013a) Antineuroinflammatory and neurotrophic effects of CNTF and C16 peptide in an acute experimental autoimmune encephalomyelitis rat model. Front Neuroanat 7, 44. [DOI] [PMC free article] [PubMed] [Google Scholar]
- Fang M, Sun Y, Hu Z, et al. (2013b) C16 peptide shown to prevent leukocyte infiltration and alleviate detrimental inflammation in acute allergic encephalomyelitis model. Neuropharmacology 70, 83–99. [DOI] [PubMed] [Google Scholar]
- Gabel S, Koncina E, Dorban G, et al. (2015) Inflammation promotes a conversion of astrocytes into neural progenitor cells via NF‐kappaB activation. Mol Neurobiol Sep 17. [Epub ahead of print]. [DOI] [PMC free article] [PubMed] [Google Scholar]
- Gajofatto A, Turatti M, Monaco S, et al. (2015) Clinical efficacy, safety, and tolerability of fingolimod for the treatment of relapsing‐remitting multiple sclerosis. Drug Healthc Patient Saf 7, 157–167. [DOI] [PMC free article] [PubMed] [Google Scholar]
- Han S, Arnold SA, Sithu SD, et al. (2010) Rescuing vasculature with intravenous angiopoietin‐1 and alpha v beta 3 integrin peptide is protective after spinal cord injury. Brain 133, 1026–1042. [DOI] [PMC free article] [PubMed] [Google Scholar]
- Han S, Zhang F, Hu Z, et al. (2013) Dose‐dependent anti‐inflammatory and neuroprotective effects of an ανβ3 integrin‐binding peptide. Mediators Inflamm 2013, 268486. [DOI] [PMC free article] [PubMed] [Google Scholar]
- Jiang H, Zhang F, Yang J, et al. (2014) Angiopoietin‐1 ameliorates inflammation‐induced vascular leakage and improves functional impairment in a rat model of acute experimental autoimmune encephalomyelitis. Exp Neurol 261, 245–257. [DOI] [PubMed] [Google Scholar]
- Kuhlmann T, Remington L, Cognet I, et al. (2006) Continued administration of ciliary neurotrophic factor protects mice from inflammatory pathology in experimental autoimmune encephalomyelitis. Am J Pathol 169, 584–598. [DOI] [PMC free article] [PubMed] [Google Scholar]
- Lecuyer MA, Kebir H, Prat A (2016) Glial influences on BBB functions and molecular players in immune cell trafficking. Biochim Biophys Acta 1862, 472–482. [DOI] [PubMed] [Google Scholar]
- Li J, Chen W, Li Y, et al. (2015) Transplantation of olfactory ensheathing cells promotes partial recovery in rats with experimental autoimmune encephalomyelitis. Int J Clin Exp Pathol 8, 11 149–11 156. [PMC free article] [PubMed] [Google Scholar]
- Linker RA, Maurer M, Gaupp S, et al. (2002) CNTF is a major protective factor in demyelinating CNS disease: a neurotrophic cytokine as modulator in neuroinflammation. Nat Med 8, 620–624. [DOI] [PubMed] [Google Scholar]
- Ma X, Jiang Y, Wu A, et al. (2010) Berberine attenuates experimental autoimmune encephalomyelitis in C57 BL/6 mice. PLoS One 5, e13489. [DOI] [PMC free article] [PubMed] [Google Scholar]
- Mason JL, Langaman C, Morell P, et al. (2001) Episodic demyelination and subsequent remyelination within the murine central nervous system: changes in axonal calibre. Neuropathol Appl Neurobiol 27, 50–58. [DOI] [PubMed] [Google Scholar]
- Nishimune H, Vasseur S, Wiese S, et al. (2000) Reg‐2 is a motoneuron neurotrophic factor and a signalling intermediate in the CNTF survival pathway. Nat Cell Biol 2, 906–914. [DOI] [PubMed] [Google Scholar]
- Sachdeva R, Theisen CC, Ninan V, et al. (2016) Exercise dependent increase in axon regeneration into peripheral nerve grafts by propriospinal but not sensory neurons after spinal cord injury is associated with modulation of regeneration‐associated genes. Exp Neurol 276, 72–82. [DOI] [PMC free article] [PubMed] [Google Scholar]
- Stankoff B, Aigrot MS, Noel F, et al. (2002) Ciliary neurotrophic factor (CNTF) enhances myelin formation: a novel role for CNTF and CNTF‐related molecules. J Neurosci 22, 9221–9227. [DOI] [PMC free article] [PubMed] [Google Scholar]
- Troncoso E, Muller D, Czellar S, et al. (2000) Epicranial sensory evoked potential recordings for repeated assessment of cortical functions in mice. J Neurosci Methods 97, 51–58. [DOI] [PubMed] [Google Scholar]
- Wang B, Tian KW, Zhang F, et al. (2015) Angiopoietin‐1 and C16 peptide attenuate vascular and inflammatory responses in experimental allergic encephalomyelitis. CNS Neurol Disord Drug Targets 15, 496–513. [DOI] [PubMed] [Google Scholar]
- Webster HD (1997) Growth factors and myelin regeneration in multiple sclerosis. Mult Scler 3, 113–120. [DOI] [PubMed] [Google Scholar]
- Yin JX, Tu JL, Lin HJ, et al. (2010) Centrally administered pertussis toxin inhibits microglia migration to the spinal cord and prevents dissemination of disease in an EAE mouse model. PLoS One 5, e12400. [DOI] [PMC free article] [PubMed] [Google Scholar]
- Yu HJ, Fei J, Chen XS, et al. (2010) Progesterone attenuates neurological behavioral deficits of experimental autoimmune encephalomyelitis through remyelination with nucleus‐sublocalized Olig1 protein. Neurosci Lett 476, 42–45. [DOI] [PubMed] [Google Scholar]
- Zhang F, Yang J, Jiang H, et al. (2014) An alphanubeta3 integrin‐binding peptide ameliorates symptoms of chronic progressive experimental autoimmune encephalomyelitis by alleviating neuroinflammatory responses in mice. J Neuroimmune Pharmacol 9, 399–412. [DOI] [PubMed] [Google Scholar]
Associated Data
This section collects any data citations, data availability statements, or supplementary materials included in this article.
Supplementary Materials
Fig. S1. (A–C) Combination treatment of C16, Ang1 and Reg‐2 reduced the clinical severity of EAE in rats at (A) 1, (B) 2 and (C) 8 weeks Pi, as measured by determining somatosensory‐evoked potential (c‐SEP) latencies and amplitudes [measured from peak to peak between negative deflection (N) and positive deflection (P)]. The amplitude of c‐SEP was notably lower in vehicle‐treated EAE rats and the latency was also significantly prolonged, while treatments with C+A, Reg‐2, especially the C+A+R group, effectively reversed these phenomena. (D–F) Motor‐evoked potential (MEP) amplitude was also significantly lower in vehicle‐treated EAE rats, and the latency was also significantly prolonged. Similarly, these phenomena were reversed following C+A and Reg‐2 and, especially, the C+A+R treatment groups.
Fig. S2. (A–F) Combination of C16, Ang1 and Reg‐2 treatments inhibited demyelination in the CNS, as showed by LFB staining. Scale bar: 100 μm. At 2 weeks Pi, massive confluent demyelinated areas were present in the parenchyma in CNS of vehicle‐treated EAE rats accompanied with the significant inflammatory cells infiltration (B,C), while at the same time point, when treated with C16+Ang1, Reg‐2 and C+A+R, visible areas of myelination were evidently preserved. (G,H) Demyelination was determined by scoring demyelination. C16+Ang1‐, Reg‐2‐ and C+A+R ‐treated rats exhibited notably less demyelination at both (A) 2 and (B) 8 weeks Pi. (A) P < 0.05 vs. vehicle‐treated EAE rats; (B) P < 0.05 vs. Reg‐2‐treated EAE rats; (C) P < 0.05 vs. C+A‐treated EAE rats.
Fig. S3. NF‐кB, COX‐2, TNF‐α and GAP‐43 expression levels increased post‐immunization, as detected by Western blotting in the brain cortex and lumbar spinal cord, while the treatments of Ang‐1+C16, Reg‐2 and C+A+R reversed the upregulation of NF‐кB, COX‐2 and TNF‐α, and further increased the expression of GAP‐43. (A) P < 0.05 vs. normal control; (B) P < 0.05 vs. vehicle‐treated EAE rats; (C) P < 0.05 vs. Reg‐2‐treated EAE rats; (D) P < 0.05 vs. C+A‐treated EAE rats.


