Figure 2.

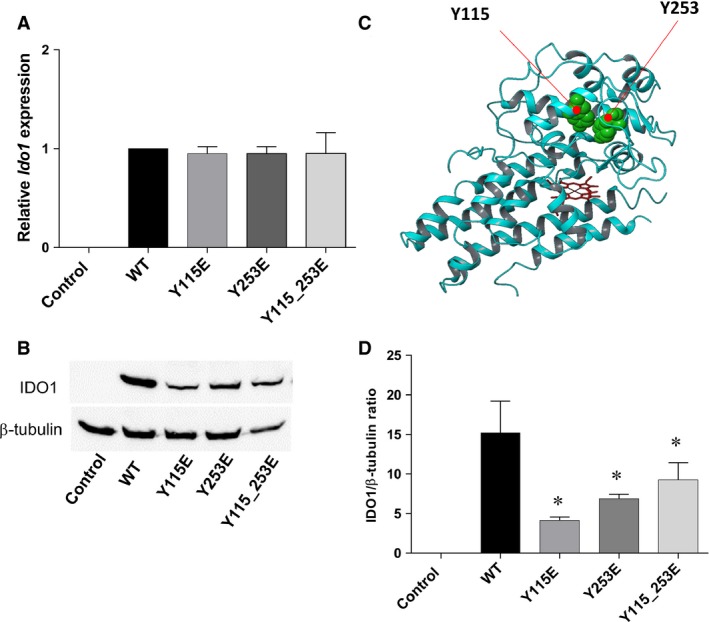
Expression of ITIM‐mutated IDO1 in transfected cells. (A) Ido1 mRNA was quantified by real‐time PCR using Gapdh normalization. Data are presented as normalized transcript expression of the mutated forms of Ido1 relative to normalized transcript expression of the WT Ido1. Results are representative of three experiments (mean ± S.D.). (B) and (C) IDO1 protein expression was analysed in WCL of WT and ITIM‐mutated IDO1 transfectants, using an IDO1‐specific antibody and anti‐β‐tubulin for normalization. One representative immunoblot analysis of three is shown. IDO1:β‐tubulin ratio was calculated by densitometric quantification of the specific bands detected in three independent experiments (mean ± S.D.). Controls in A, B and C are represented by mock‐transfected cells. *P < 0.05, mutants versus WT (Student’s t‐test). (D) Ribbon structure of IDO1 (pdb code: 2D0T) showing Y115 and Y253 (green balls) with poor solvent‐accessible surface.
