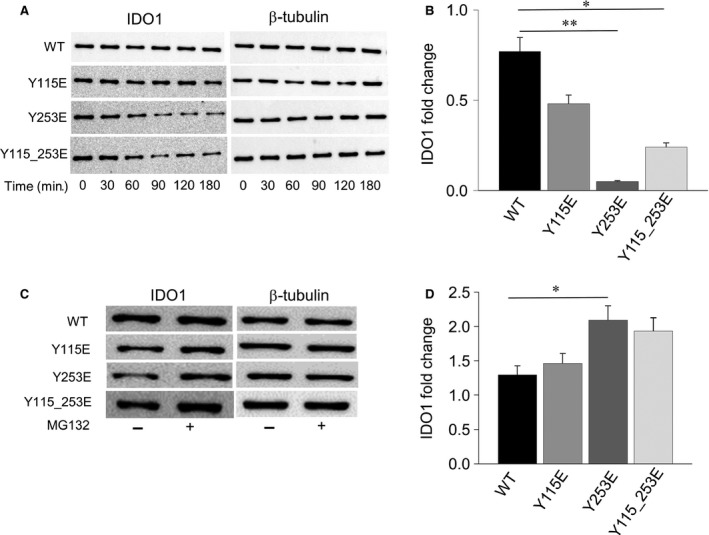
Figure 4.

Half‐life of ITIM‐mutated IDO1 proteins. (A) Cycloheximide (50 μM) was added to the cultures and transfected P1.HTR tumour cells were harvested at the indicated time‐points (0–180 min.). WCL was subjected to immunoblot analysis, using an IDO1‐specific antibody. Detection of β‐tubulin served as a loading control. One representative experiment is shown. (B) Quantitative analysis of triplicate gels (mean ± S.D.), one of which represented in (A). For each sample, the ratio of normalized IDO1 protein at 180 min. over time 0 was represented (IDO1 fold change within 180 min.). *P < 0.05, **P < 0.01, mutants versus WT (Student’s t‐test). (C) Proteasome inhibition restores IDO1 expression in transfected cells. Cells were treated with MG132 (at 10 μM for 180 min.) before WCLs were collected for immunoblot analysis of IDO1, using β‐tubulin detection as a loading control. One representative experiment of three is shown. (D) Quantitative analysis of triplicate gels (mean ± S.D.), one of which represented in (C). For each cell type, the ratio of normalized IDO1 protein in MG132‐treated over untreated cells was evaluated by densitometry (IDO1 fold change upon proteasome inhibition). *P < 0.05, mutant versus WT (Student’s t‐test).
