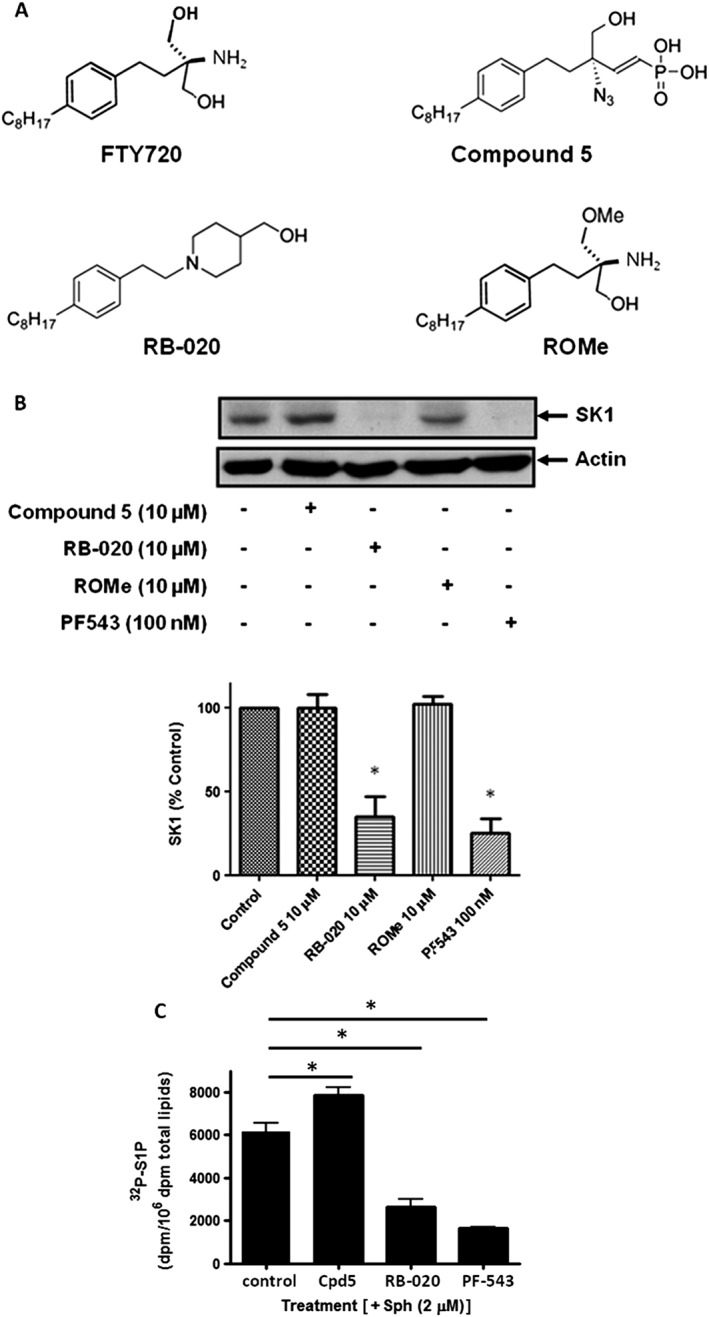
Figure 1.

Chemical structures and effects on SK1 expression and S1P formation in cells. (A) Chemical structures of FTY720, compound 5, RB‐020 and ROMe. (B) Western blot showing the effect of compound 5 (Cpd5; 10 μM), RB‐020 (10 μM), PF543 (100 nM) and ROMe (10 μM) on the expression levels of SK1 in LNCaP‐AI cells. Actin was used as a loading control. Results are representative of five independent experiments. Also shown is the densitometric quantification represented as a bar graph. *P < 0.05, significantly different from control. (C) Bar graphs showing the effect of compound 5 (30 μM), RB‐020 (10 μM) and PF‐543 (100 nM) on S1P formation from exogenously added sphingosine in HLMVECs. Results are expressed as means ± SD for three independent experiments *P < 0. 05, significantly different from control; one‐way ANOVA with Bonferroni post test. Control values are: basal [32P]S1P = 718 + 169 dpm; plus sphingosine [32P]S1P = 6154 + 569 dpm.
