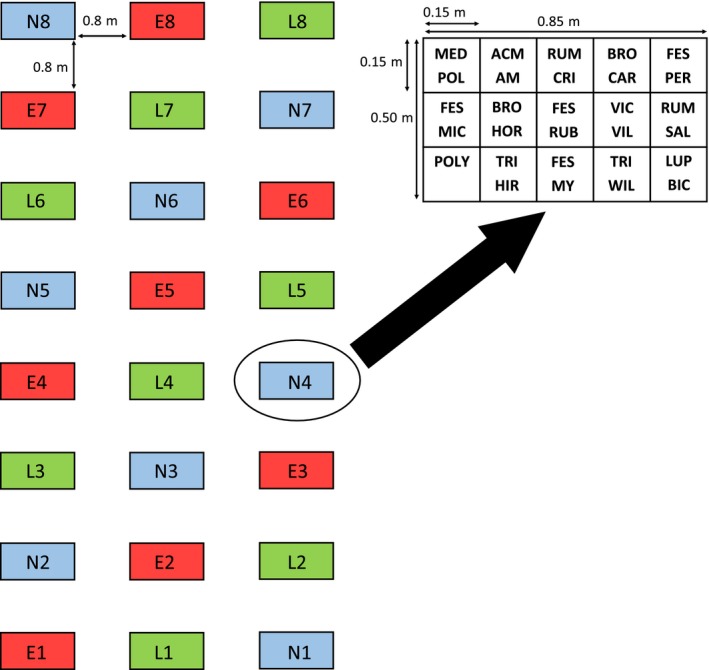
Figure 1.

Experimental design showing the arrangement of 24 plots (left) and example arrangement of subplots within a single plot (above). One plot in each of early, late, and no exclusion treatments (red, green, and blue rectangles, respectively) is represented in every block of three plots. Within plots, one polyculture subplot (POLY) and 14 monoculture subplots (see Table 1 for species abbreviations) are arranged in a 3 × 5 grid. Two monoculture subplots were planted with Rumex spp. (“RUM CRI” and “RUM SAL”); these failed to emerge and were removed from all analyses
