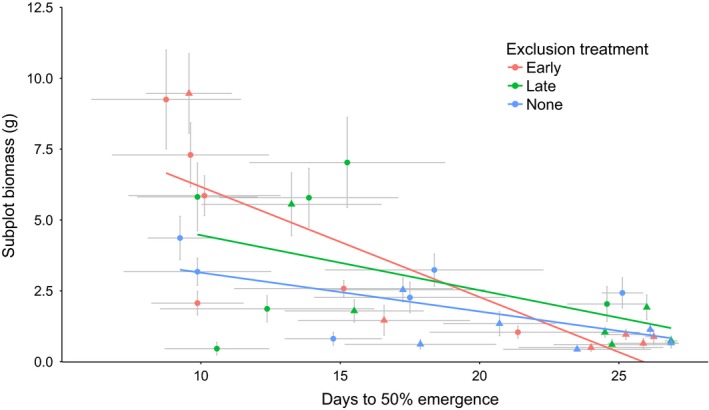
Figure 4.

Scatter plot of monoculture subplot biomass in relation to emergence time for species in each exclusion treatment. Exotic species are denoted by circles, and native species are denoted by triangles. Horizontal and vertical gray bars denote one standard error of the mean, where n is the number of replicates within each exclusion treatment for each species
