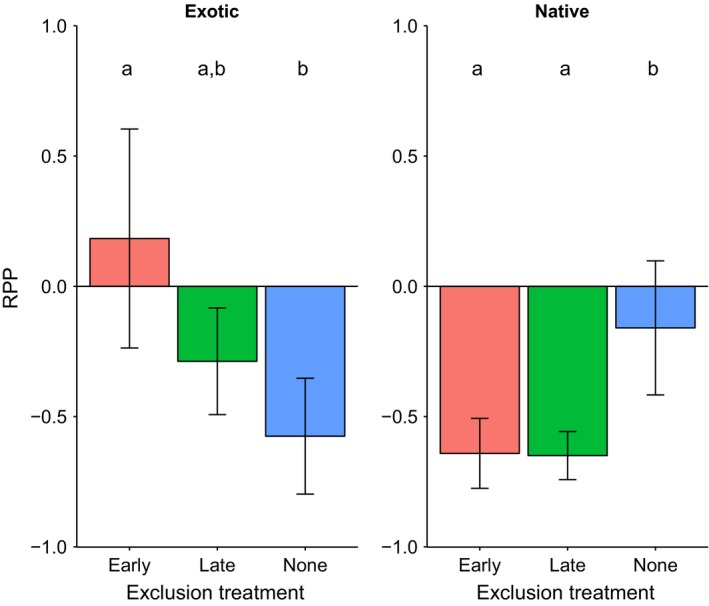
Figure 5.

Relative performance in polyculture (RPP) in each exclusion treatment for exotic species (left) and native species (right). Error bars represent one standard error of the mean, where n = 6, the number of species in each exclusion treatment. Groups sharing letters do not differ significantly in post hoc Tukey's tests
