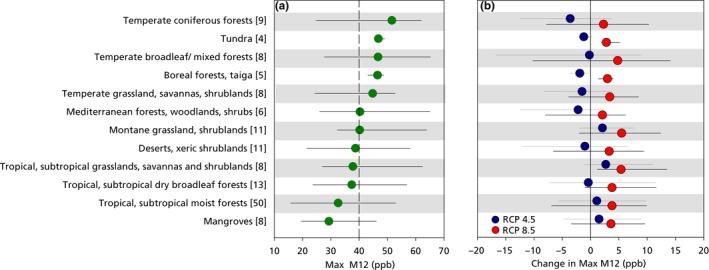
Figure 3.

(a) Simulated O3 exposure in 2000 in G200 terrestrial ecoregions (ERs), grouped by biome. (b) Change in simulated O3 exposure between 2000 and 2050 under RCP4.5 and RCP8.5. ERs are grouped by major biome, and the number of ERs in each biome is shown within brackets. Exposure in (a) is based on the highest of the four seasonal M12 values (Max M12, ppb) in each ER. The dashed line in (a) represents the M12 corresponding to the threshold used to calculate concentration‐based critical levels according to the UNECE CLRTAP. Values are shown for the mean value within the biome (circles) and the minimum/maximum range of values in individual ERs within that biome. Note that the average for the major biomes smoothed out some of the large exposure values shown in Figure 1 for the individual G200 biomes
