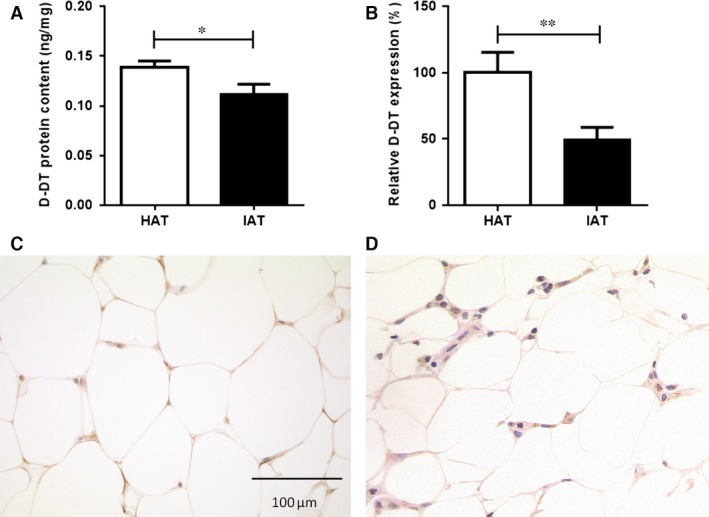
Figure 1.

Levels of D‐DT in native HAT and IAT. Adipose tissue from healthy donor sites and acutely inflamed donor sites were homogenized. D‐DT protein levels were analysed by ELISA and D‐DT mRNA levels were measured by quantitative real‐time PCR. (A) D‐DT protein levels were significantly decreased in IAT compared to native HAT. Data are presented as mean ± S.E.M., n = 54–28, two‐tailed Student's t‐test. (B) Relative D‐DT expression levels in adipose tissue derived from HAT and IAT showed a decrease of D‐DT expression in IAT. Data are presented as mean ± S.E.M., n = 13–16, two‐tailed Student's t‐test. Statistically significant differences are indicated by asterisks (*P < 0.05, **P < 0.01). D‐DT expression was analysed by immunohistochemistry on formalin fixed whole adipose tissue of (C) HAT and (D) IAT samples (magnification 400 × ). Shown are representative pictures of D‐DT staining.
