
Figure 2.
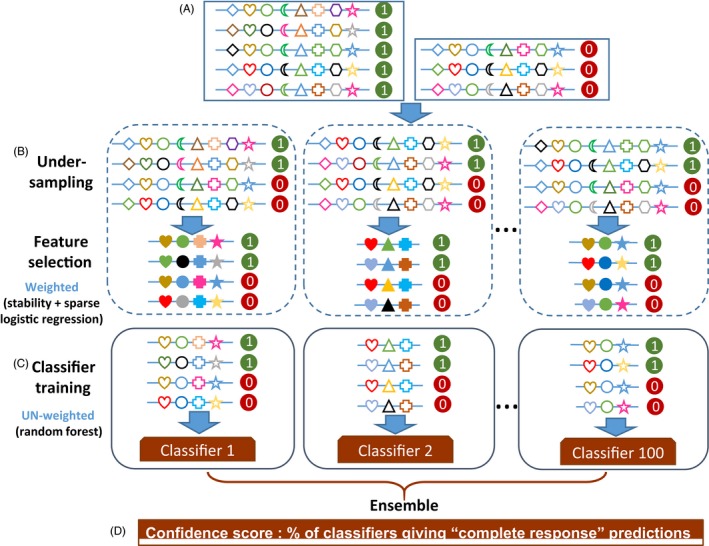
Graphical representation of the workflow of evolution‐informed modeling. (A) Input matrix. Each row represents a sample, with positive samples (i.e., with poor clinical outcomes) labeled as “1” and negative samples (i.e., with good clinical outcomes) labeled as “0.” Each column represents a feature, as indicated by different symbols. (B) Feature selection. Subsets of the input data are generated using under‐sampling that randomly chooses equal numbers of positive and negative samples. For each subset, feature values are transformed with composite weights. Feature selection is then applied on the weighted features. Using stability selection and sparse logistic regression, informative features are selected. Open symbols represent un‐weighted features. Solid symbols represent weighted features. (C) Classification model. For each subset, un‐weighted values of selected features are used to build a random forest classifier (a submodel). Collectively, these submodels comprise the ensemble model. (D) Prediction. For an unknown sample, each submodel produces a predicted label. The majority rule is used for the final prediction. The percentage of submodels that predict the sample as the positive class label is used as the confidence score of the final prediction