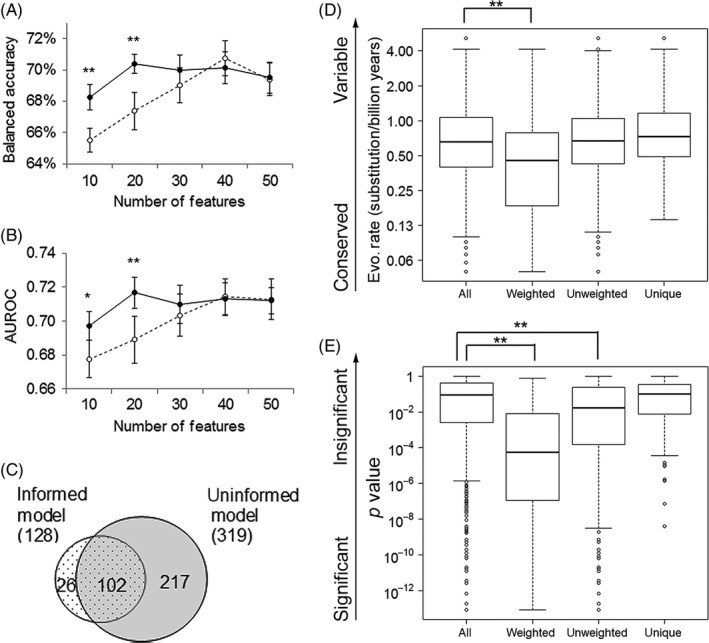
Figure 4.

Evolution‐informed modeling to predict metastasis for prostate cancers. Balanced accuracy (A) and AUROC values (B) for evolution‐informed models (solid lines) and for un‐weighted models (broken lines) that include various numbers of features. Average values with standard errors are plotted. * and ** indicate significant difference with t test p value <.05 or <.01, respectively. (C) Venn diagram of proteins included in the top‐performing evolution‐informed model and in the top‐performing uninformed model. Box plots to compare the distributions of evolutionary rate (D) and statistical significance (E) between all proteins, proteins included in the top‐performing evolution‐informed model, proteins included in the top‐performing uninformed models, and proteins unique to the top‐performing uninformed model. ** indicates significant difference with t test p value <.01
