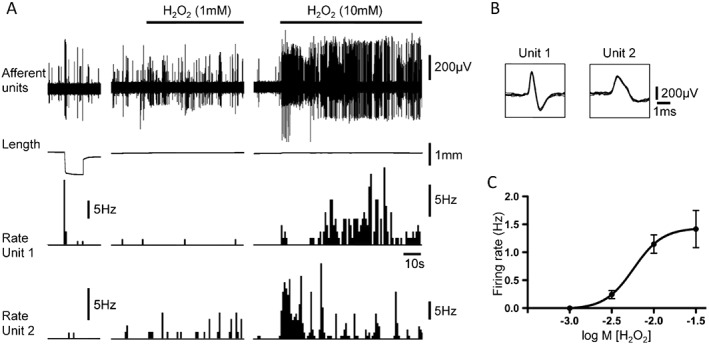
Figure 3.

Responses of low threshold stretch‐sensitive and high threshold afferents to a high concentration of H2O2 (10 mM). (A) Typical traces showing activation of low threshold stretch‐sensitive afferents (unit 1) and high threshold afferents (unit 2) by H2O2 (10 mM). In contrast to the high threshold afferent, the low threshold stretch‐sensitive afferent was not activated by 1 mM H2O2. Note that the low threshold stretch‐sensitive afferent, but not the high threshold afferent, was strongly activated by stretch with 50 mN load. (B) The shape of seven superimposed action potentials for each of the two discriminated units from tracings in A: unit 1 – low threshold stretch‐sensitive afferent; unit 2 – high threshold afferent. (C) Concentration‐response curve for activation of low threshold stretch‐sensitive afferents (n = 7, N = 6) by H2O2.
